
As a trader, it's crucial to have a solid understanding of the tools and techniques that can help you make profitable trading decisions. One such tool set is trading indicators, which can provide valuable insights into market trends and potential price movements. Whether you're a seasoned professional or just starting out, these indicators can help you to better analyze market conditions and make more effective trades.
What is a trading indicator?
Top-5 trading indicators:
Trading indicators can be classified into two types: leading indicators and lagging indicators. Leading indicators provide forecast signals anticipating future price movements while lagging indicators analyze past trends to indicate momentum.
Here are the top 5 trading indicators commonly used by traders:
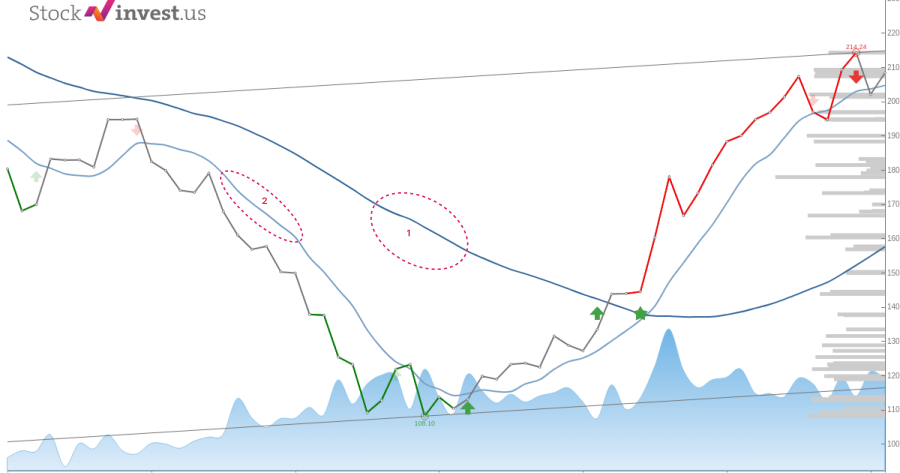
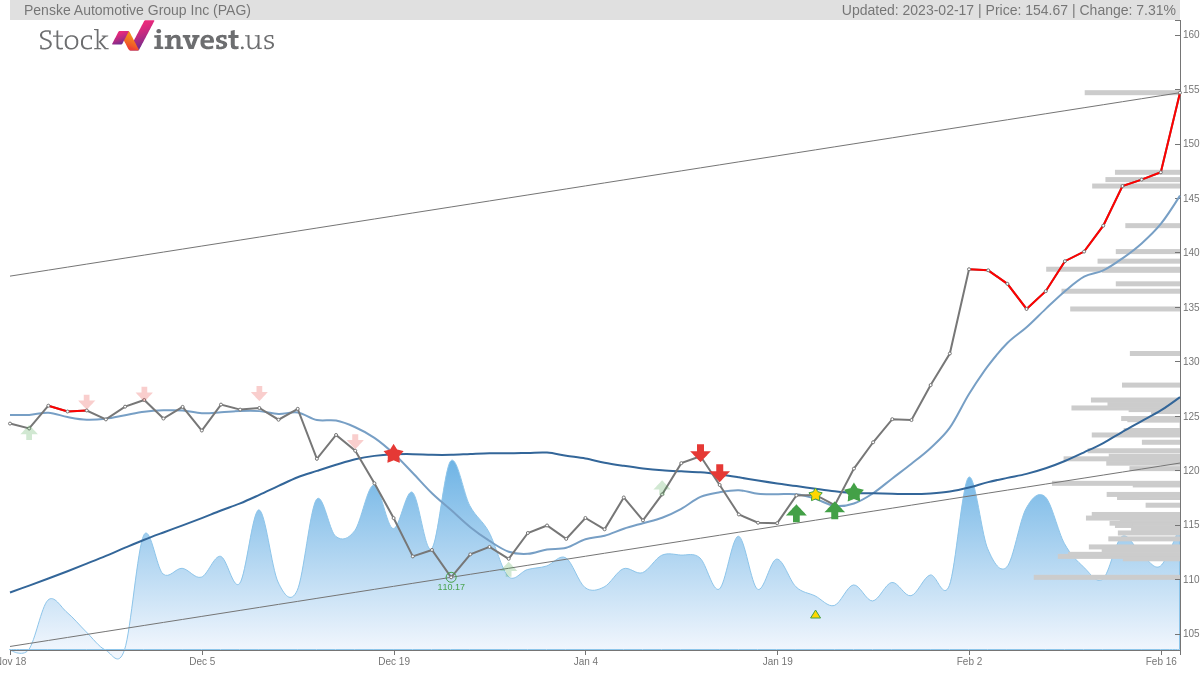
1.Moving averages (MA): A moving average is a line that shows the average price of an asset over a set time. Traders use moving averages to identify the trend's direction and determine support and resistance levels.
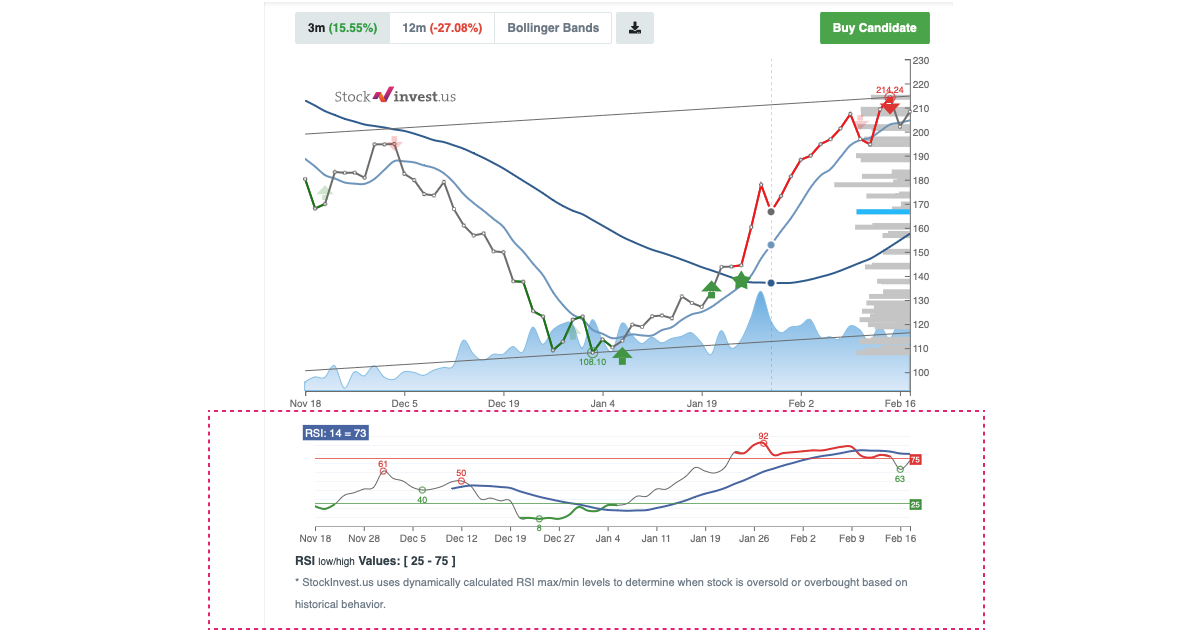
2. Relative strength index (RSI): RSI is a momentum oscillator that measures the speed and change of price movements. Traders use RSI to identify overbought and oversold conditions and determine whether a trend will continue or reverse.
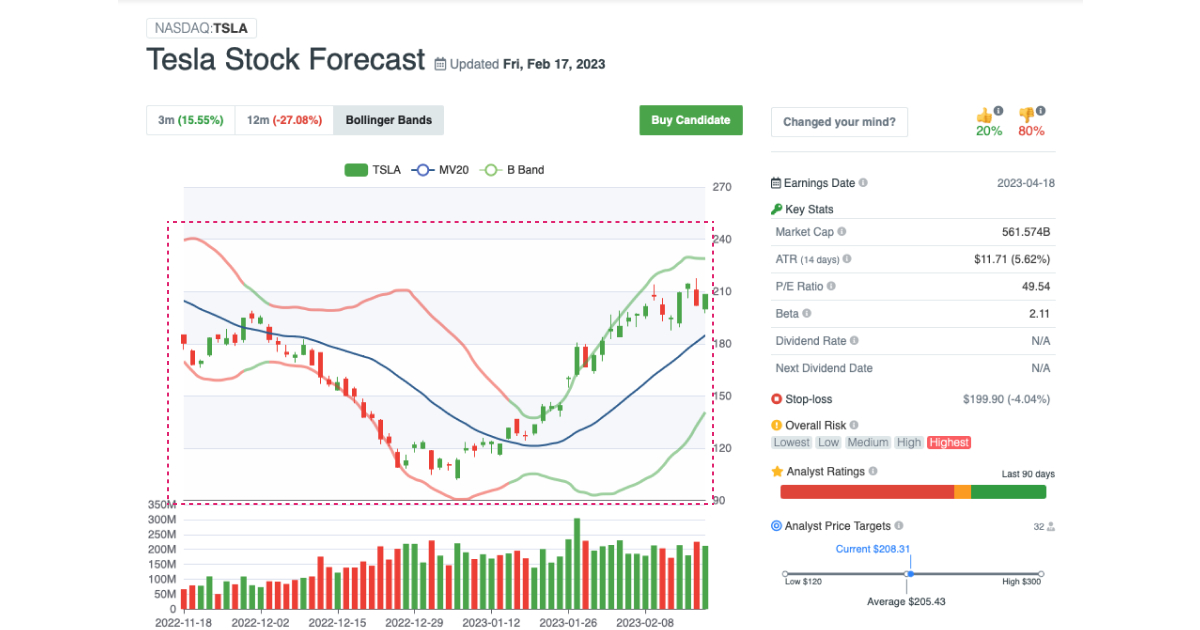
3. Bollinger Bands: Bollinger Bands are a set of lines plotted two standard deviations away from a moving average. Traders use Bollinger Bands to identify volatility and to determine whether an asset is overbought or oversold.
4. Fibonacci retracements: Fibonacci retracements are used to identify potential support and resistance levels based on the Fibonacci sequence. Traders use these levels to identify possible buy or sell signals.
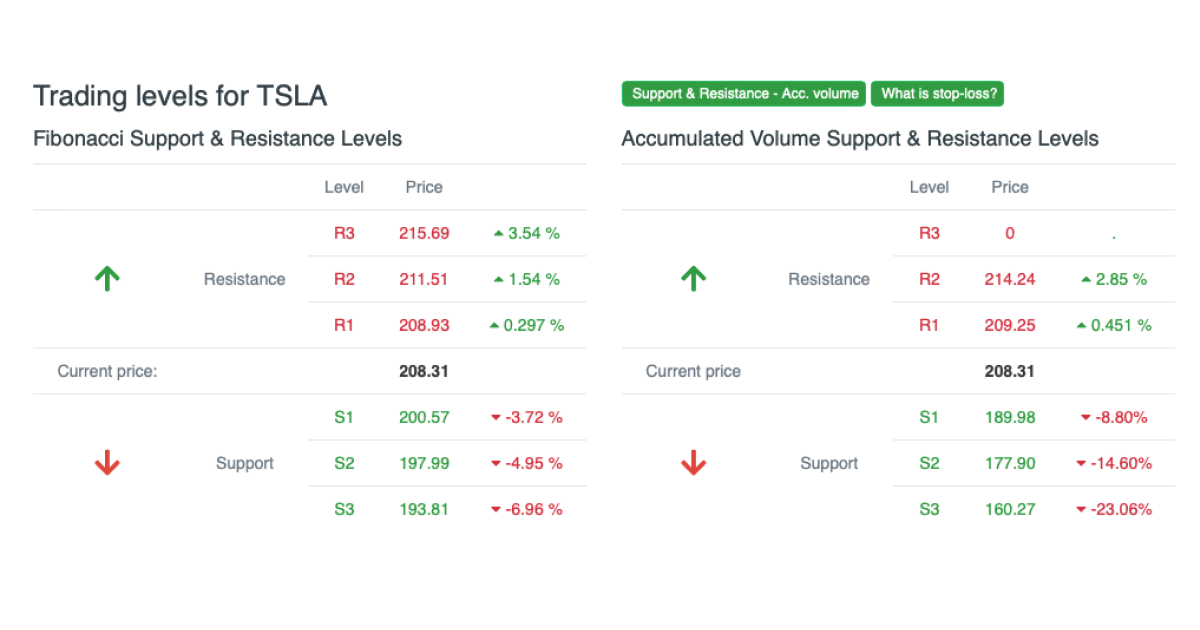
5. Pivot points are a technical analysis indicator used to determine potential support and resistance levels in an asset's price movement. Pivot points are calculated based on the previous trading session's high, low, and close prices. Traders use pivot points to identify potential entry and exit points, as well as to determine the overall trend of an asset. Pivot points can be used with other technical indicators to make trading decisions.

Which indicator has the highest accuracy?
No single indicator has the highest accuracy in trading, as market conditions can be highly unpredictable and volatile. In fact, relying solely on a single indicator for trading decisions can be risky.
The most successful traders often use a combination of indicators, such as moving averages, Bollinger Bands, and MACD, to gain a more comprehensive understanding of market trends and to confirm potential signals before making a trade. It's also important to consider other factors, such as news events, economic data, and overall market sentiment, when making trading decisions.
Ultimately, a trader's success depends on their ability to analyze and interpret various market data, develop a sound trading strategy, and effectively manage risk.
One more rare technical analysis signal - Golden Star:
In technical analysis, there are helpful signals that can assist in selecting promising stocks for purchase, one of which is the Golden Star.
Introduced by Jim Stromberg at getagraph.com in 2007, the Golden Star is a technical signal based on the Golden Cross but has additional conditions for the signal to appear. The moving averages used in the signal must be chosen based on the selected time frame and must cross the price line in a specific pattern. These conditions improve upon the Golden Cross, resulting in the Golden Star.
To effectively use the Golden Star signal, it's important to review the stock's historical chart to better understand its potential. It's worth noting that some stocks may take a longer time to reach their full potential. Additionally, the signal is delayed by at least two trading days to confirm its validity.
In conclusion:
Technical analysis provides information to traders looking to make informed trading decisions.
By utilizing various indicators and signals, such as the Golden Star or Bollinger Bands, traders can better understand potential buying opportunities. However, it's important to note that no single indicator is foolproof. Traders should always perform their due diligence by analyzing market conditions, historical trends, and other factors before trading. The most successful traders have a solid understanding of technical analysis principles and a strong risk management strategy to protect their investments.


