
Volume is perhaps the best indicator of all and should follow the price; if volume goes up, the price increases. Divergence is the typical trading spot you want to look for if this does not happen. However, the sorted and accumulated volume also defines support and resistance levels. Why would you trade a stock that is about to hit a resistance level if you can avoid it?
In the picture below, which is a snapshot of the Microsoft (MSFT) chart after trading on 23 February 2022, you can see the accumulated volume as grey bars on the right-hand axis.
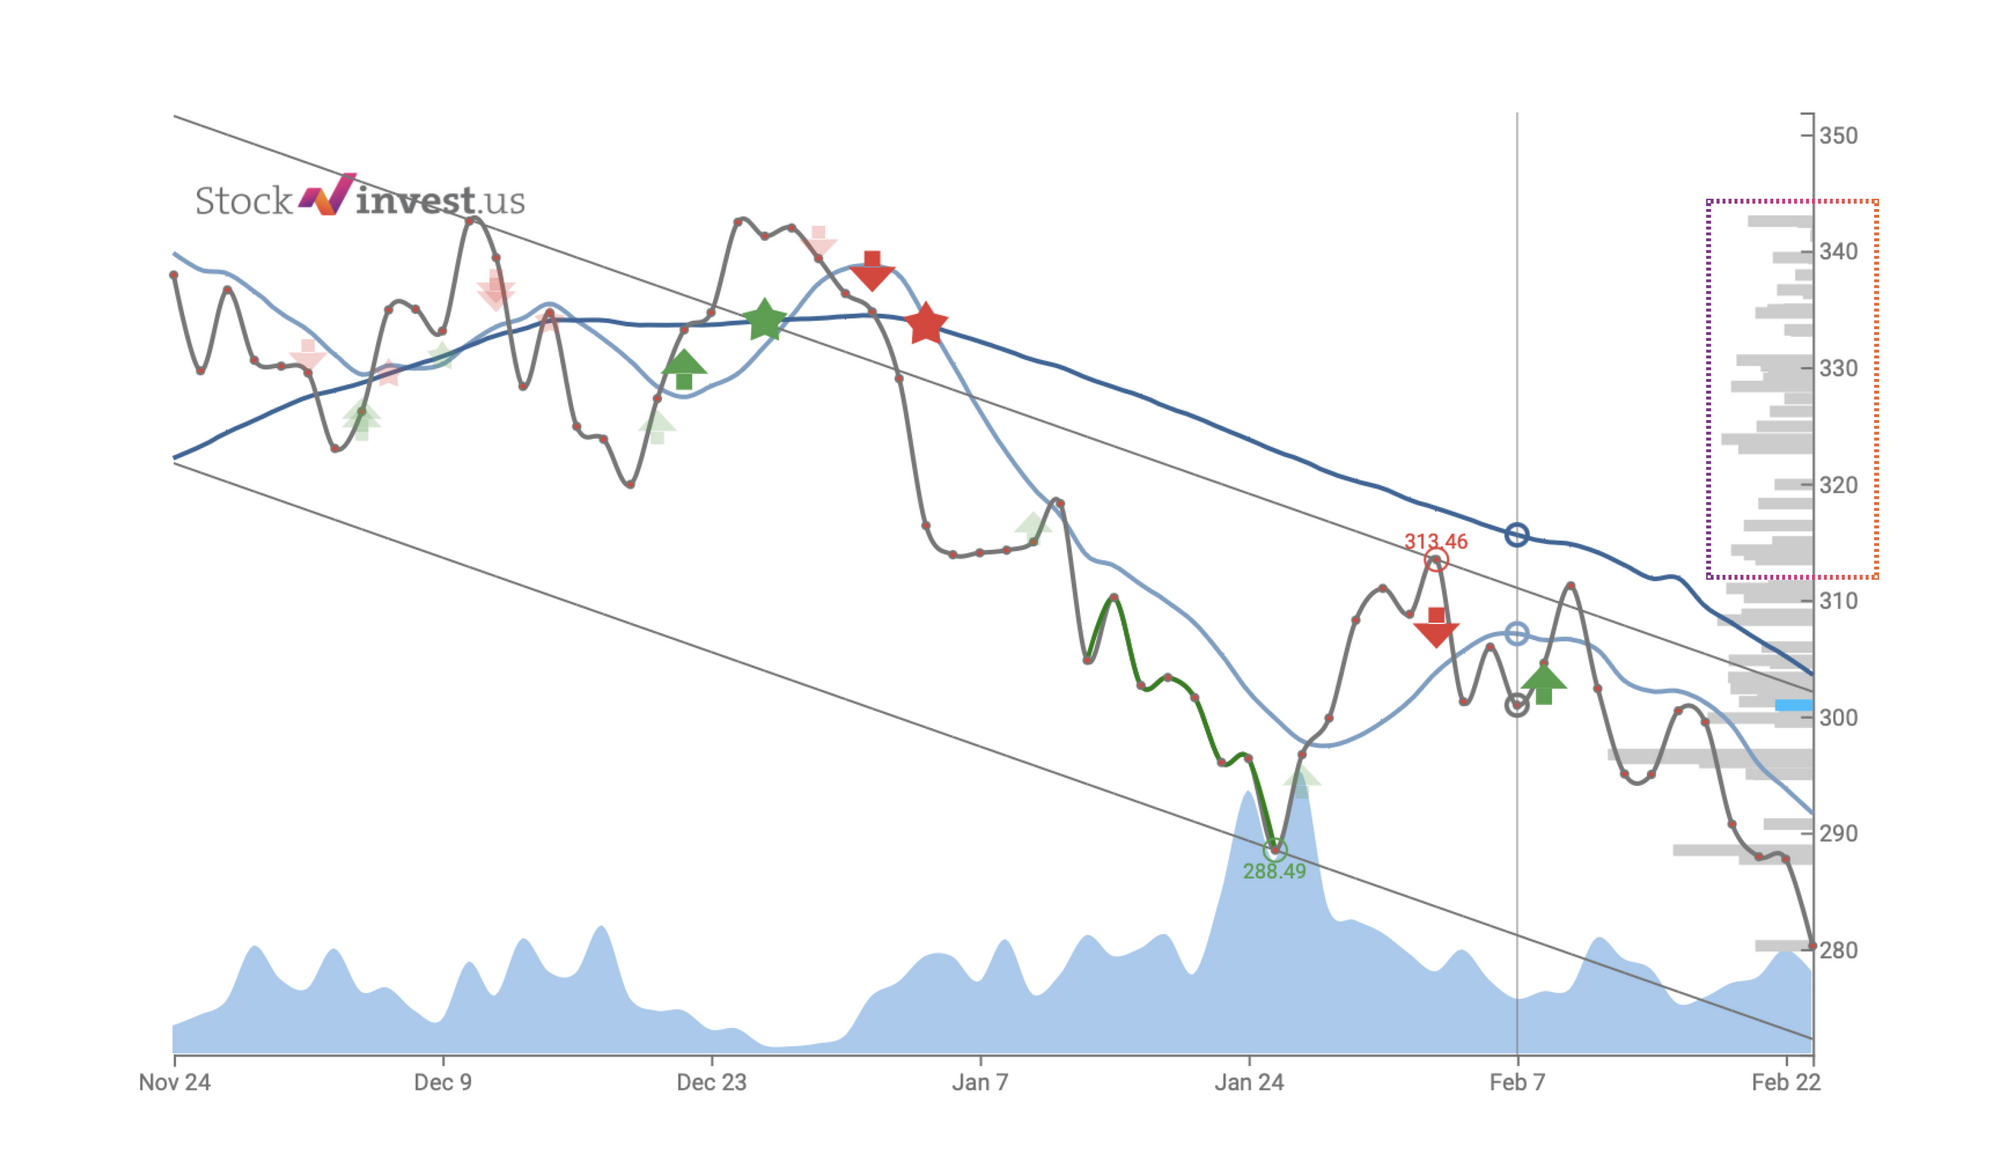
The bars indicate how much stocks have been traded on each price during the chart period. The theory is elementary: people buying at a given level will use this guide as the decision point. Imagine you purchased MSFT at $278. The current price is $280.27. You are still at profit and would consider $278 as another chance to buy cheap, and since you’re human, you will be reluctant to sell. That makes $278 a support level. The strength of the level depends on how many shares were sold and bought at that price (accumulated). Visually this is seen as longer or shorter bars or the right axis.
On the other hand, if the stock turns up there is a lot of people who bought at $300. These are impatiently waiting for stock to get back so they can dump their shares without losses. That is why $300 becomes a resistance level. It is vital to understand that liquidity and volatility of the share have a huge influence.
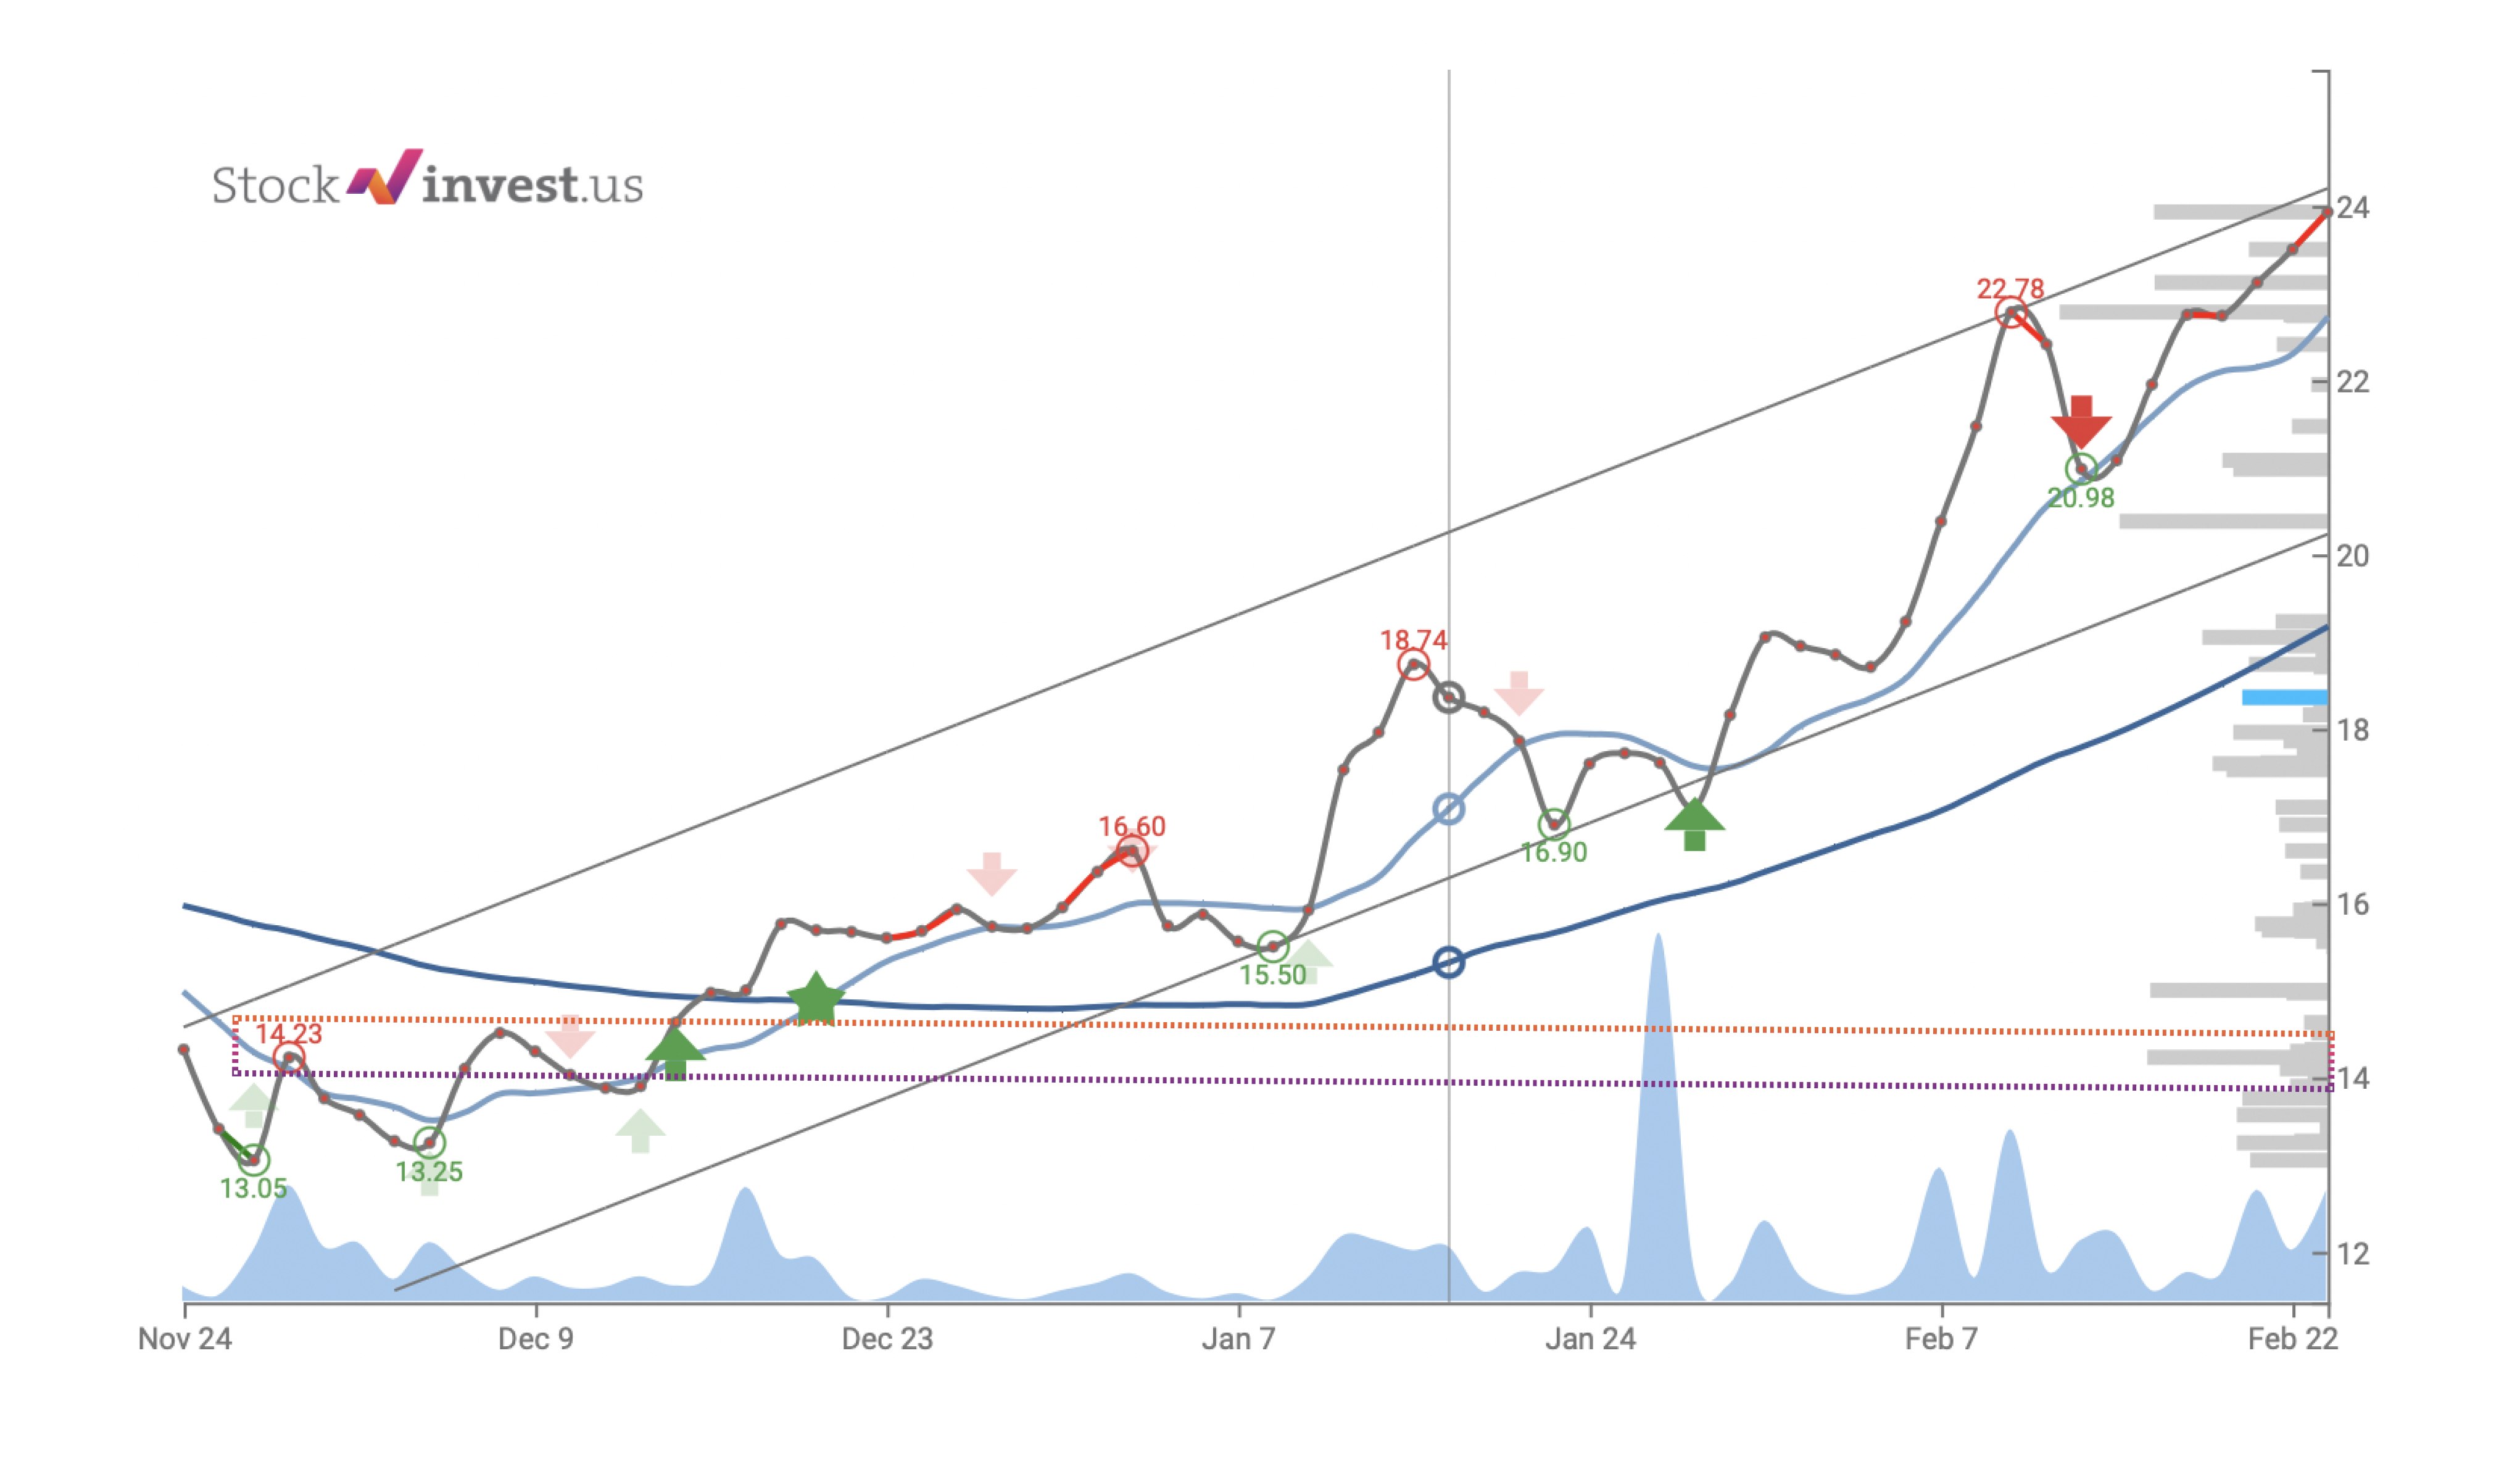
Over time the importance of previous events is reduced. This also applies to accumulated volume. This means that the recent volume is of more importance than previous volumes. The logic is that more and more people are getting out of their previous positions, and therefore the resistance and support no longer have the same validity. A technical analysis tool like ours can be accounted for by using “weighted accumulate volume.” When using weighted accumulated volume, you emphasize recent volume more and less on past volume. As a trader, you can not remember all the small tweaks and twists, but you should understand the logic of how things work as the same rule applies for all indicators in general. Over time you will see that support and resistance from accumulated volume work very well and should be a part of any trading strategy. There are a few unwritten rules like the stock always will try two times to break a good resistance, so you never buy on the first attempt. If not breaking on the second attempt, it most likely will not manage to do it in the very short term. The picture below shows how MIRM tried to break through $14.23 (on November 30th, 2021 and on December 8th, 2021) twice without making it and caused a double top formation, triggering a sell signal.
Now you think you have it. Just look for the grey bars. Long bars mean good support or resistance. Put your buy or sell above or below, depending on the aforementioned observation. However, it is a bit more complicated than that. Due to fundamental issues like new stock issuance and bids, you can have large transactions recorded. Despite the huge accumulated volume, these are still valid as support/resistance but do not have the same strength. This was the case of Snapchat (SNAP), where stocks were issued to investors with great discounts and put out for trade at market price. This led most investors to take immediate profit, and the stock plunged. You should look at clusters of accumulated volume, just like shown above with red circles.
Lack of trading at a certain level (no accumulated volume - resistance or support) gives room for rapid movements. These are some of our favorite trading opportunities. Some of them you can find on our social media (Facebook and Twitter).
https://twitter.com/StockInvestUS/
https://www.facebook.com/stockinvest/
You can not call every move correctly, but why would you buy knowing there is no good support below the current level? The only reason we see is that you either know something nobody else does or don’t measure your risks, which is a fast way to lose money.
Accumulated volume could be used as an indicator alone, but combining it with volume and other indicators becomes even more powerful. The magic of numbers like 1, 10, and 100 also plays a role, but if you study enough charts, accumulated volume is often peaking around these numbers. If resistance is met at already high volume (seen in bluish at the bottom of each chart), there is very little chance for resistance to be broken, while if it is met at low but rising volume, there is an excellent chance it will. The reason and logic are that there is a higher interest than resistance or, in other words, more buyers than sellers, and they keep coming (rising volume).
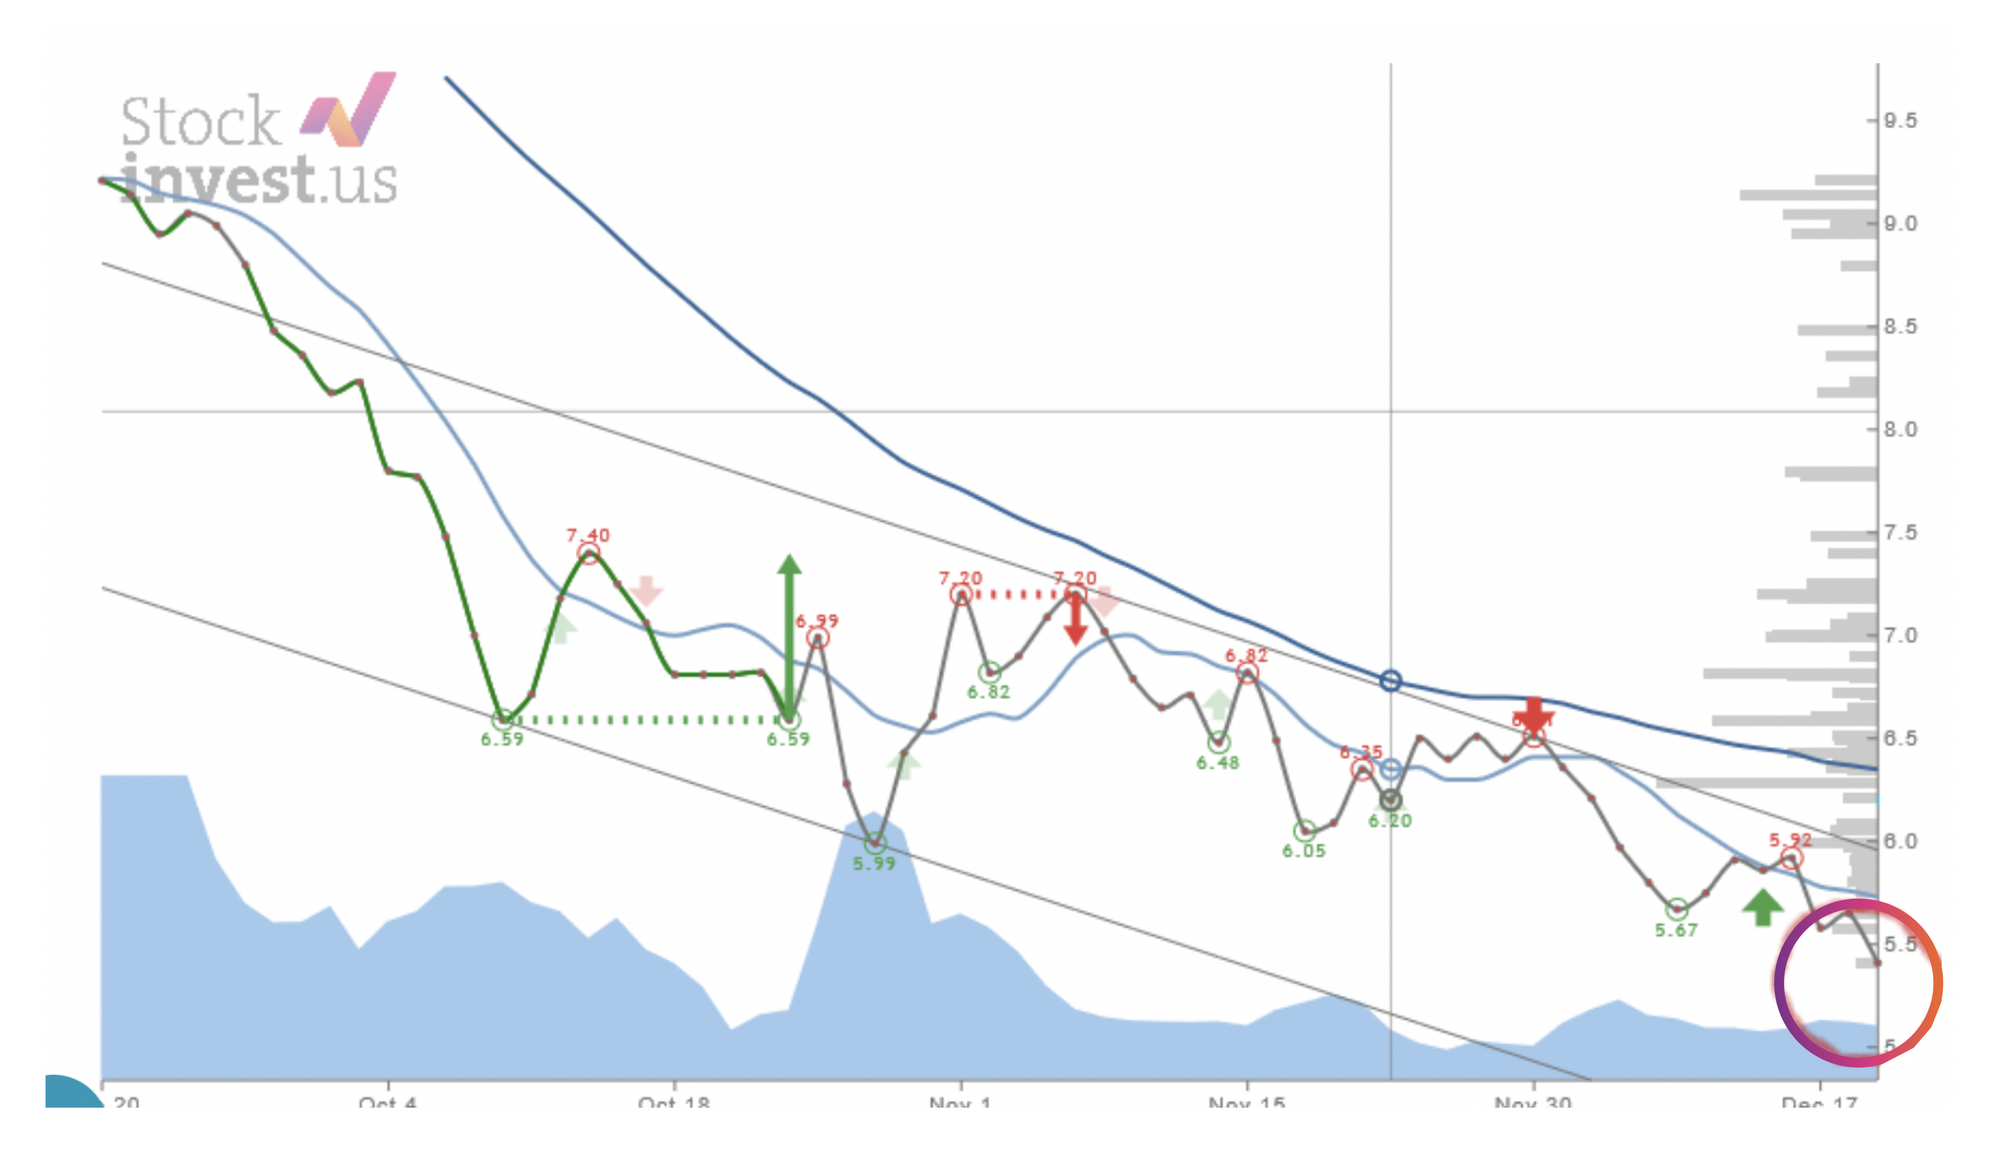
In the picture above, you can see SNAP as of December 19th 2018. Currently, the price stands at no support, and above is a ton of resistance. Your logic may say that it has fallen so much that it has to be a good buy case right now, but the fact is that technically this stock is doomed for an even deeper and quicker fall to $5. It is far more lucrative to short than anything else from a trading perspective. There is always a chance of some fundamental news disrupting the picture, an offer, or a deal for something, and often these are thrown out by the management itself to do some damage, control, or try to influence the share price. There is no better example in the world for this trick than Elon Musk’s behavior at Tesla. As a careful trader with a good strategy, you would avoid SNAP unless you take a short. If and when it turns, it will still face much resistance, and first, between $7.50 and $9.00, there is a free lunch to grab at a decent risk/reward.
Conclusion:
The lesson is that accumulated volume offers you a very good chance to time your buy and sell better. It also gives you an indication of what to expect. Much resistance will provide a slower move upwards than little resistance. The same goes for support and vice versa. Now you can add this knowledge to your strategy. For example, never buy shares with a lack of e.g 5% support under your buying level. This simple example will save you in many cases as it will allow you to get out before too much damage is done if the shit hits the fan. It would be best to never depend on accumulated volume alone but use it together with many other indicators. For example, to use volume as part of defining the stop-loss.
Stay tuned for more!


