
Have you ever wondered what the average true range (ATR) is and how it can be handy to you as an investor or trader? In this blog post, we'll discuss what the ATR is, how it's calculated, and how you can use it to improve your trading and investing results. Stay tuned!
What is the Average True Range (ATR)? Definition.
Or in a more common language: the expected range the stock will move within during the trading day.
This indicator was created by J. Welles Wilder Jr. and introduced in his book, "New Concepts in Technical Trading Systems" in 1978. Since then, investors and traders have used it to check how prices change over time and as an indicator for future price movements.
It is essential to know what volatility levels you're working with so that your trades won't get hurt too badly if they go against market trends.
What is the Average True Range (ATR) used for?
The ATR can be used to help you identify trends, set stop-loss orders, and make other trading decisions.
For example, if you are looking at a stock with an ATR of 20 over the last five days, you can see that the stock's price has fluctuated by an average of 20 percent each day. This information can help determine whether or not the stock is having a lot of attention and how aggressively it might be moving. This knowledge is particularly useful for swing/day traders who aim to profit from big stock movements.
As the ATR is an expression of risk, the indicator can help the trader determine the size of a trade, something that is especially crucial in the derivate markets and for other products with gearing where sudden movements can cause positions to be closed or require cash infusion.
However, ATR does have some limitations.
First, the ATR shows volatility and not the direction of an asset's price. Also, it doesn't consider volume or other information that may be important in a given market or stock.
You have to keep in mind that ATR is open to interpretation because different people use it differently. For instance, they may use different periods to calculate the ATR, which can affect its usefulness.
Difference between True Range (TR) and Average True Range (ATR).
While the ATR is simply the average of a stock's true ranges over a specified time period, there are some essential differences between these two volatility measures.
The True Range (TR) measures market volatility by incorporating price and volume data, while the ATR only considers price movements. In addition, while the ATR takes into account all forms of price movement (including gaps), the TR only feels the difference between a stock's current high and low prices.
How do you calculate the Average True Range (ATR)?
The ATR is calculated by taking the average of the true ranges over a specified time. The True Range is the greatest of the following:
- The current high less the current low;
- The absolute value of the current high less the previous close;
- The absolute value of the current low less the previous close;
For example, if a stock's current high is $10, its current low is $9, its previous close was $8, and its opening price today was also $8, then:
True range = MAX$(High - Low$, |High - Previous Close|$, |Low - Previous Close|$) = MAX $(10 - 9$, |10 - 8|$, |9 - 8|$)= $1
ATR = AVG of the True Range values calculated over a specified period, such as 5, 10, or 14 days.
To calculate the ATR for a stock over a given time period, add up all of its daily ATRs and divide by the number of days. For example, if we want to calculate the ATR for a stock over the last 5 days, we would add up all 5 of its daily ATRs: $1 + 2 + 3 + 4 + 5 = 15$. Then, we would divide this total ($15) by 5 to get an average ATR of $3 over the 5-day period.
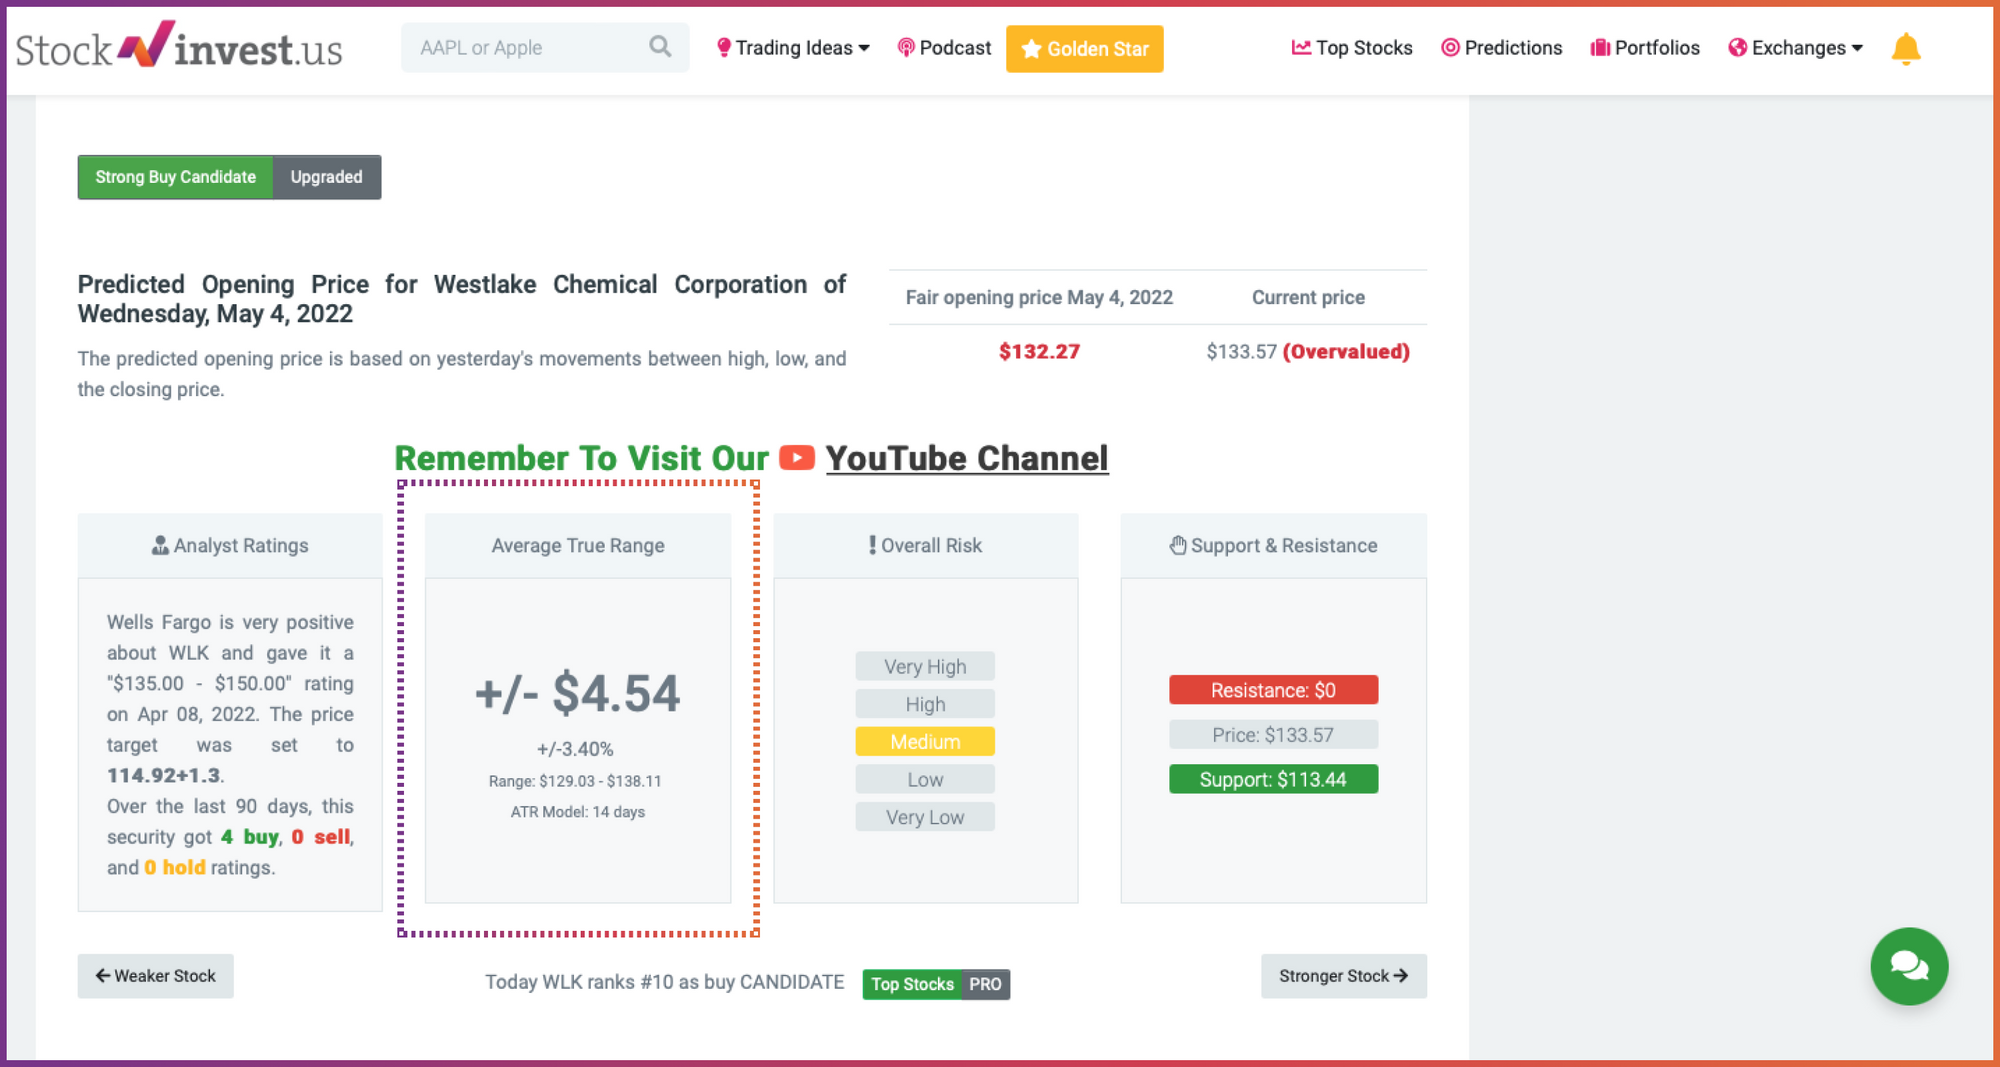
On StockInvest.us, we want to make our user's life easier; that's why you can find the ATR (14) on each analysis page for the 38 000 tickers we analyze.
Conclusion:
Despite these limitations, the Average True Range is a convenient tool for understanding market volatility and making more informed investment decisions. The ATR can help you navigate today's rapidly changing markets and make more confident investing choices.
So why wait? Start exploring this powerful indicator today!


