There are two ways to make money in the stock market: buying stocks in log-term to get dividends and through fluctuations in the price of stocks.
In the first case, everything is simple - the company periodically pays a part of the profit to the holders of its securities. The second case is more complex. A trader needs to buy when stock is cheap and sell when it is expensive. The hardest part of this scheme is deciding exactly when to make a trade. The profit depends on how accurately the trader predicts the price dynamics.
Let's discuss what analysis and indicators will help you see trend changes and price fluctuations in perspective.
How is the stock price formed?
In an initial public offering, a company is worth as much as its assets. However, when the market later turns on, the joint-stock company receives a new characteristic - market capitalization.
You can buy and sell stocks at any time while the exchange is open, and its price changes with each new transaction. No matter how we scale the graph, it will always be a jagged line within one minute or one decade.
The skill of a trader is to catch the price movement and predict what will happen to the asset in the next minute. Technical and fundamental analysis will help predict the price.
Fundamental and technical analysis.
The technical analysis methodology uses price change charts, patterns, and signals. This technique allows predicting price changes in the future by analyzing past and current position price changes. It is based on the analysis of time series of prices, most often charts with different timeframes.
Fundamental analysis is based on studying the company's economic, financial, and production indicators and their investment attractiveness. A trader should do all this to determine securities' real or "fair" value with a high degree of certainty.
Fundamental analysis works better in the long term - weeks, months, and even years. And technical analysis can be applied even at periods of a few minutes. Therefore, an investor should pay much attention to fundamental analysis when planning a portfolio for the long-term - months and years.
It is impossible to say which is better - fundamental analysis or technical analysis with complete certainty. Both work according to their own laws and have their own limits of applicability. It is impossible to build a forecast for several years ahead based on technical analysis. At the same time, the fundamental analysis considers the market's psychology to a limited extent and will not allow predicting spontaneous hype or panic selling.
The choice of methods depends on your strategy. If you plan to work on short time intervals, you can focus on charts. Fundamental analysis takes time and calculations and can still fail due to unexpected news. But it will allow you to keep abreast of the situation in the industry and warn about "junk" low-liquid assets of unreliable issuers.
For long-term investments, fundamental analysis of industries and companies is better suited to indicate stable and promising securities. But the charts will help you find the optimal entry point: you need to select an asset and wait until the patterns predict an upward trend reversal.
How to predict changes in the price of a stock?
Like many skills, price prediction also requires practice. Analyze the company's history, price fluctuations for its shares during the short and long periods, pay attention to technical indicators (growth or fall in volume, RSI, pivot points). You can read about these indicators here:
https://blog.stockinvest.us/relative-strength-index/
https://blog.stockinvest.us/pivot-points/
https://blog.stockinvest.us/volume-the-indicator-you-need-to-know/
Stay tuned for news about companies that are on your watchlist. And, of course, for information related to the industry. Do not forget that the price can change before and after earnings reports.
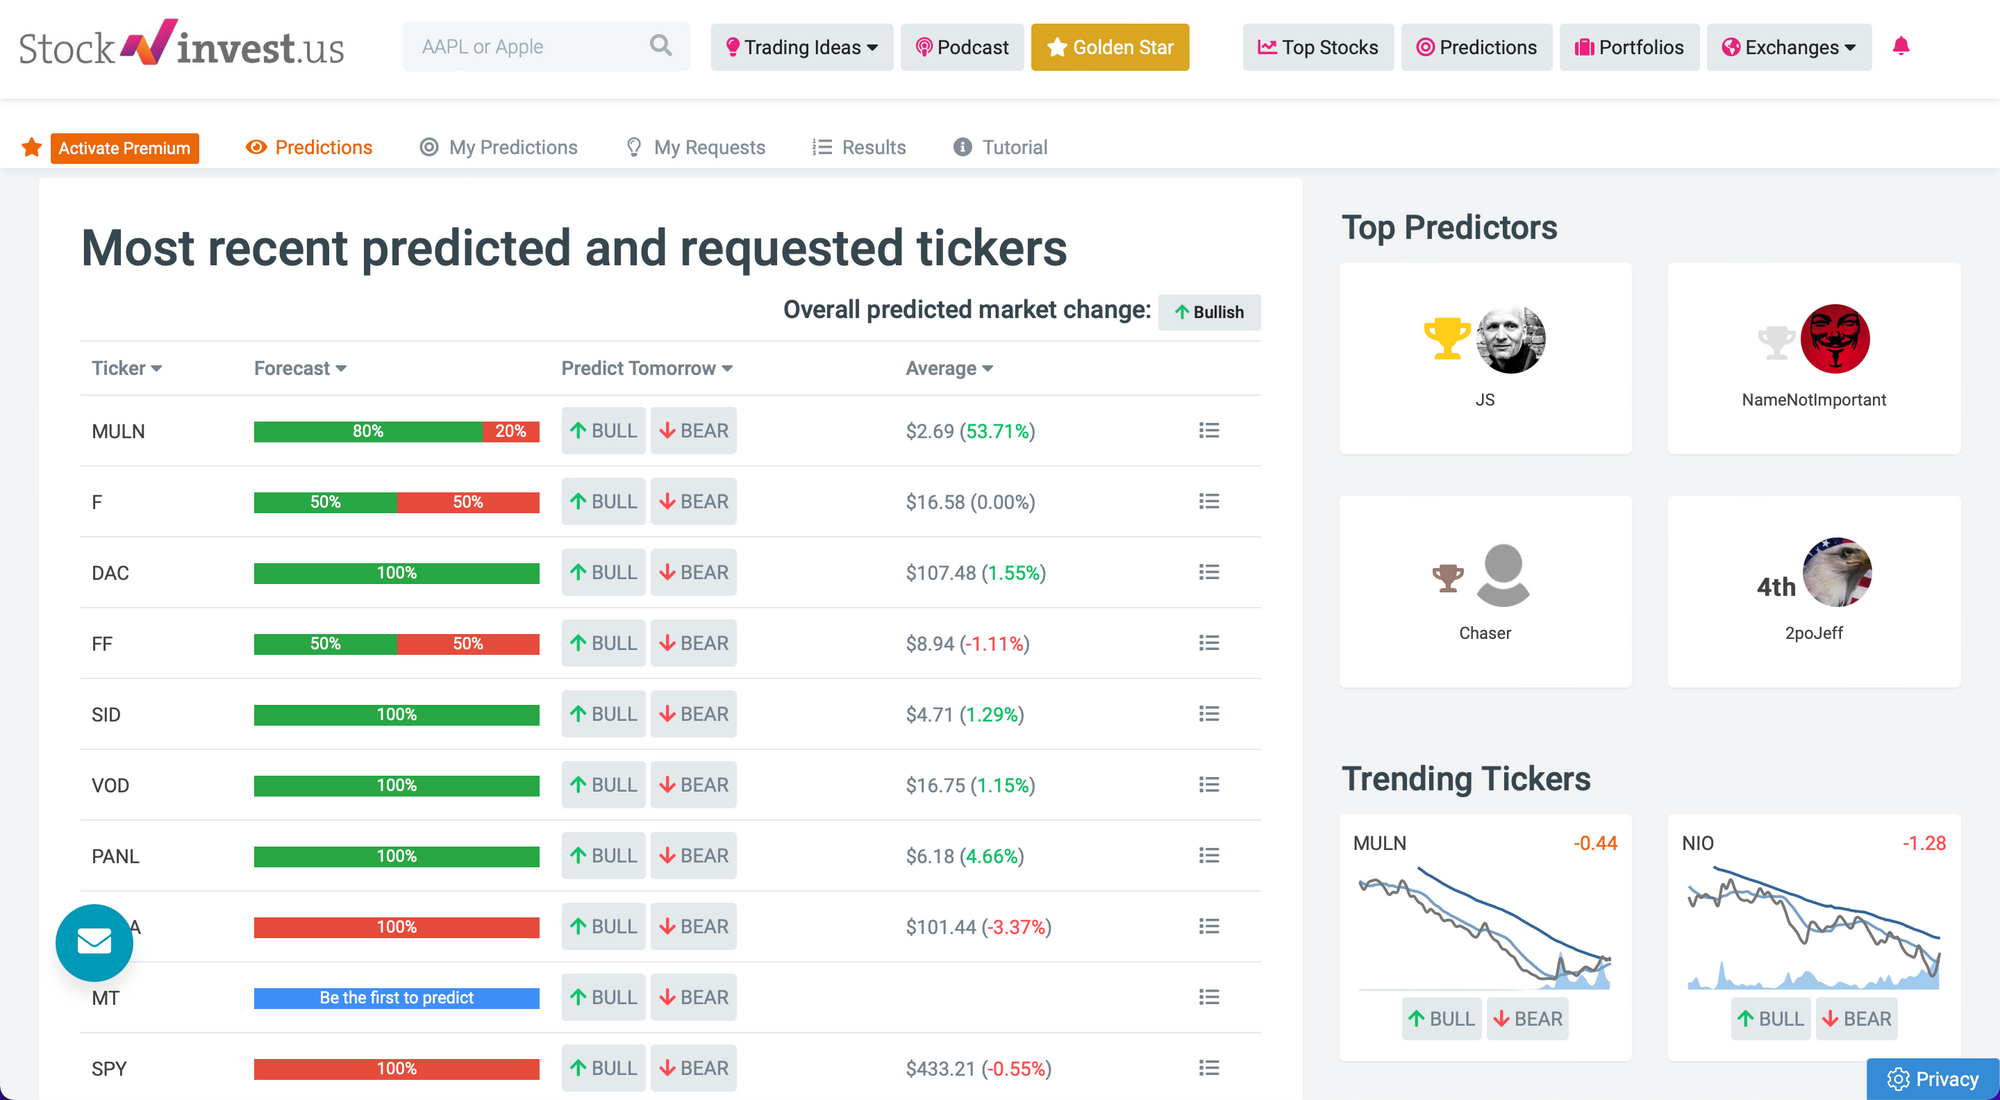
For our users, we also offer a free simulator for such practice. Here you can learn how to predict on 35,000 stocks and compete with other users in accuracy. Over time, you will see the dependence of certain events, patterns, and trends on price changes.
Thank you for being with us! Stay tuned.


