
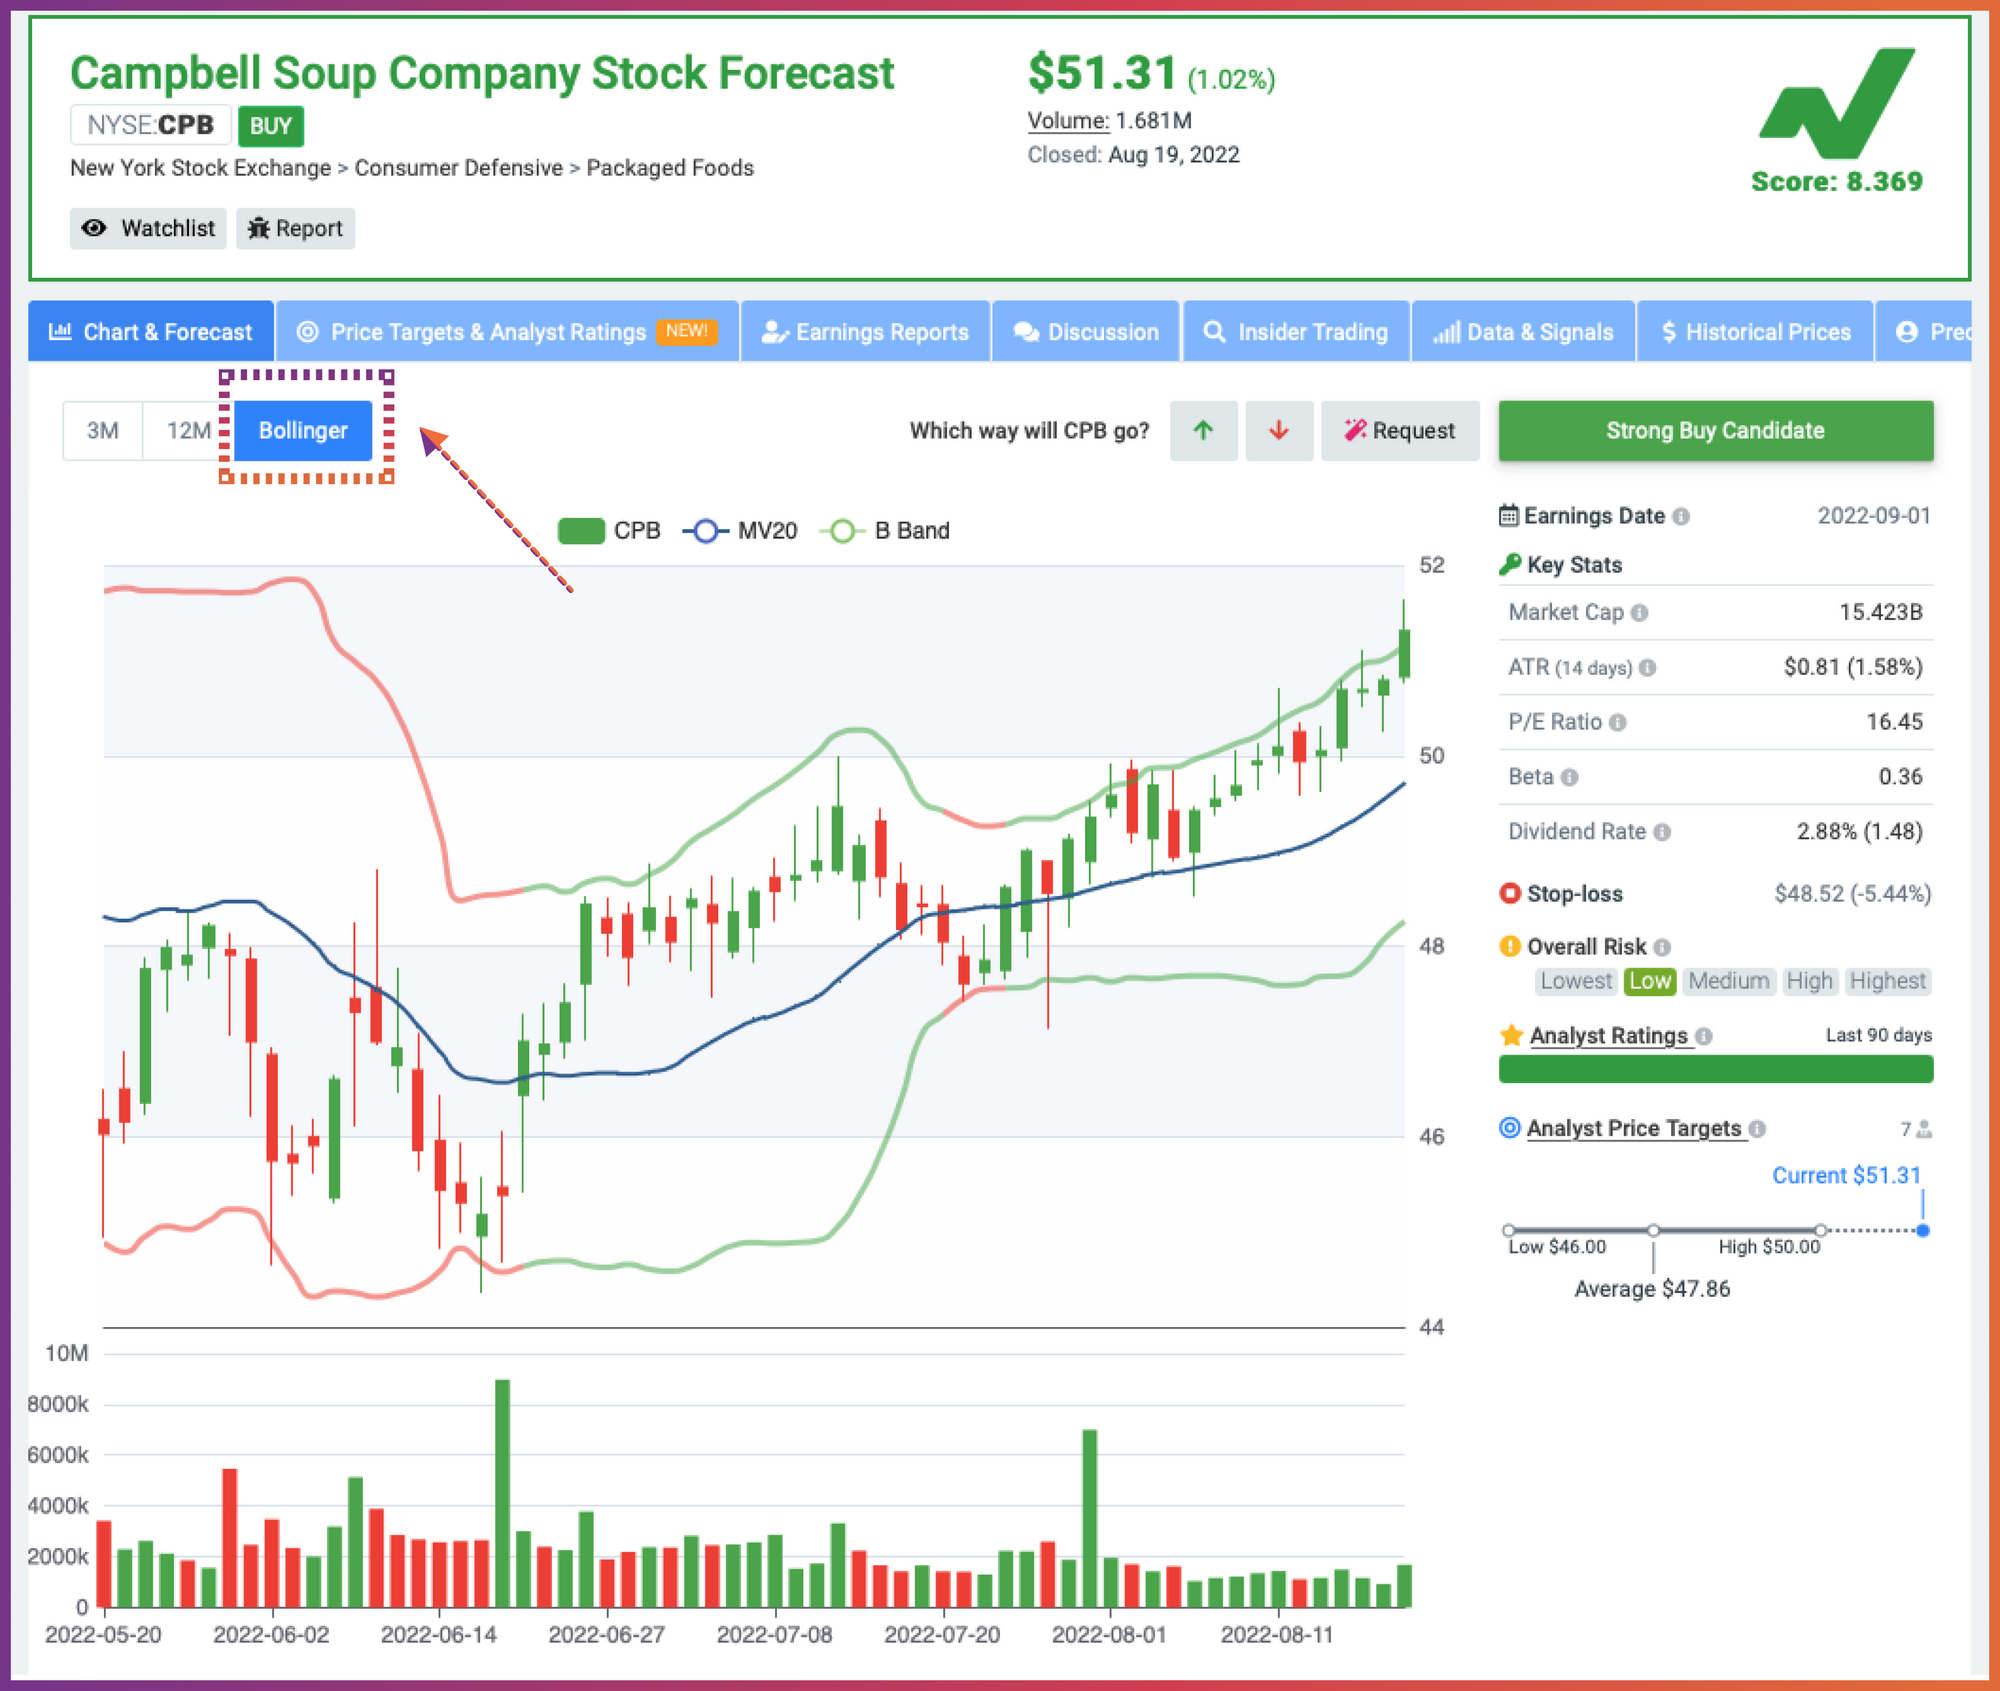
Bollinger Bands are one of the most popular technical analysis tools used by traders. Named after their inventor, John Bollinger, Bollinger Bands are bands that are plotted two standard deviations away from a simple moving average.
In this blog post, we will discuss the history of Bollinger Bands and why it can be helpful to trade stocks!
What are Bollinger Bands?
Bollinger Bands are a technical analysis tool that is used to measure volatility. They have plotted two standard deviations away from a simple moving average.
Bollinger Bands can be used to measure overbought and oversold conditions, help to predict price reversals, and more.
There are three components to Bollinger Bands:
- The middle band is a simple moving average (SMA)
- The upper band is the SMA plus two standard deviations
- The lower band is the SMA minus two standard deviations
Bollinger Bands are plotted on a price chart and can be used to identify overbought and oversold conditions, as well as predict price reversals.
When the prices are trading close to the upper Bollinger Band, it is considered overbought. This means that the stock may be due for a pullback or reversal. On the other hand, when prices are trading close to the lower Bollinger Band, it is considered oversold. In easy words, the stock may be due for a rally.
Who invented Bollinger Bands?
John Bollinger invented Bollinger Bands in the early 1980s. Mr. Bollinger is a financial analyst who noticed a lack of tools available to measure volatility. After some time, he developed his indicator - Bollinger Bands, to solve this problem.
In 2001 he wrote a book Bollinger on Bollinger Bands that has been translated into 11 languages and is still considered a bestseller.

How to Calculate Bollinger Bands?
Bollinger Bands consist of three curves drawn in relation to securities prices. The middle band is a measure of the intermediate-term trend, usually a simple moving average, that serves as the base for the upper and lower bands. The interval between the upper and lower bands and the middle band is determined by volatility, typically the standard deviation of the same data that were used for the average. StockInvest.us uses Bollingers suggested 20-day average.
- Middle Bollinger Band = 20-period simple moving average
- Upper Bollinger Band = Middle Bollinger Band + 2 * 20-period standard deviation
- Lower Bollinger Band = Middle Bollinger Band - 2 * 20-period standard deviation
Bandwidth = (Upper Bollinger Band - Lower Bollinger Band) / Middle Bollinger Band
%b = (Last - Lower Bollinger Band) / (Upper Bollinger Band - Lower Bollinger Band)
- Bandwidth defines the current width of the band.
- %b defines the current position within the band.
Bandwidth bottlenecks indicate an upcoming change. Break up through the moving average line, or continuously movements above the moving average line indicate a breakup, and vice versa downwards.
Do Bollinger Bands work?
Bollinger Bands are quite a popular technique. Mr. Bollinger has written Bollinger Bands Rules. Since then, many traders and technical analysis software packages have used it.
Bollinger Bands can tell you about:
- Breakouts. Bollinger Bands can be used to identify breakout patterns. A lot of price actions occur between the two bands. Any breakout below or above these bands can indicate essential events. However, it would help if you remembered that such breakouts are not a trading signal.
- The Squeeze. When the bands come close together, it is called a squeeze. This signals that there may be an increase in volatility. Traders look for trading opportunities accordingly to take advantage of this trend shift before prices change again. Still, these conditions don't tell you when exactly changes will happen or what direction they'll go into.
The best way to use Bollinger Bands is to combine them with other technical indicators such as the RSI or MACD and fundamental analysis.
Bollinger Bands Limitations.
Like all strategies and theories, this one also has its limitations. First, you must remember that Bollinger Bands will not predict asset prices. It is a primarily reactive tool.
Bollinger Bands don't consider the underlying trends in price movement, which may be caused by fundamental factors such as earnings releases or economic indicators.
Since they are based on a simple moving average and use of past and recent data combinations, there is a chance that outdated signals may dilute the new information.
It should also be noted that this method must be configured separately for each trader because its effectiveness varies from market to market or over time.
Summery
Bollinger Bands are a popular technical analysis tool used to measure volatility in stock markets.
It can identify breakout patterns, squeezes, and trend shifts; however, it should not be used alone as they have limitations. Combining Bollinger Bands with other technical indicators and fundamental analysis may provide a more accurate reading.
Thank you for reading! We hope Bollinger Bands will become a valuable tool in your technical analysis arsenal.


