
Pivot Points refer to points of significant change. As a trader, you had several pivotal moments in your trading history. It may be the day you learn that what goes up also goes down. The one trade that was so green and you were high above the sky, but still got sold with loss several months later. It may be the day you realize that no lunch is for free and that beating the market actually requires work. You need to stay ahead of the game. These moments stand out to you as moments of change. They teach you not to be so greedy, take profit, stop trading, and focus on funds instead.
The points that signal a significant change.
In technical analysis, Pivot Points are the points that signal a significant change. This does not necessarily mean that price direction changes from going up to going down. It may very well be major shifts in volume, RSI, or other technical indicators. We refer Pivot Points as short-term tops and bottoms in our system. These are defined using zigzag patterns and signal possible good buy and sell opportunities. You can use Pivot Points as your only trading strategy; the downside is the loss occurring before and after pivot points are identified. There has to be a bottom before a bottom can be identified. The typical signal delay is 2 time units. If we look statistically, it usually means that about 33-66% of the possible profit is lost as you get in or out too late. The 33-66% range is due to a repetitive pattern called ⅓ or ⅔.
It may be three days up and two days down in a less rising trend. This same rule applies in many cases and can be seen in typical re-bounce stocks (stocks that fall very hard) that instantly react and regain ⅓ of the fall.
If life was easy, you could buy and sell on Pivot Point signals and still make a good profit. But that is also just another way of losing your money. There is no point in buying on Pivot Bottom if the average gain between Pivot Bottom and top is 1%, knowing you will lose % in both beginning and end of trade due to signal delay. You will need substantial cash to make a profit on 0.33-0.66% considering you have to pay trading fees and have a certain degree of risk involved. And this is the second key - Risk! The risk is equally high if you go for stocks with a very high gap between Pivot Bottoms and tops. The secret is to be patient and identify stocks with as predictable a pattern as possible. Usually predictable means that its pattern is repetitive, and you can more or less see it by looking at the chart.
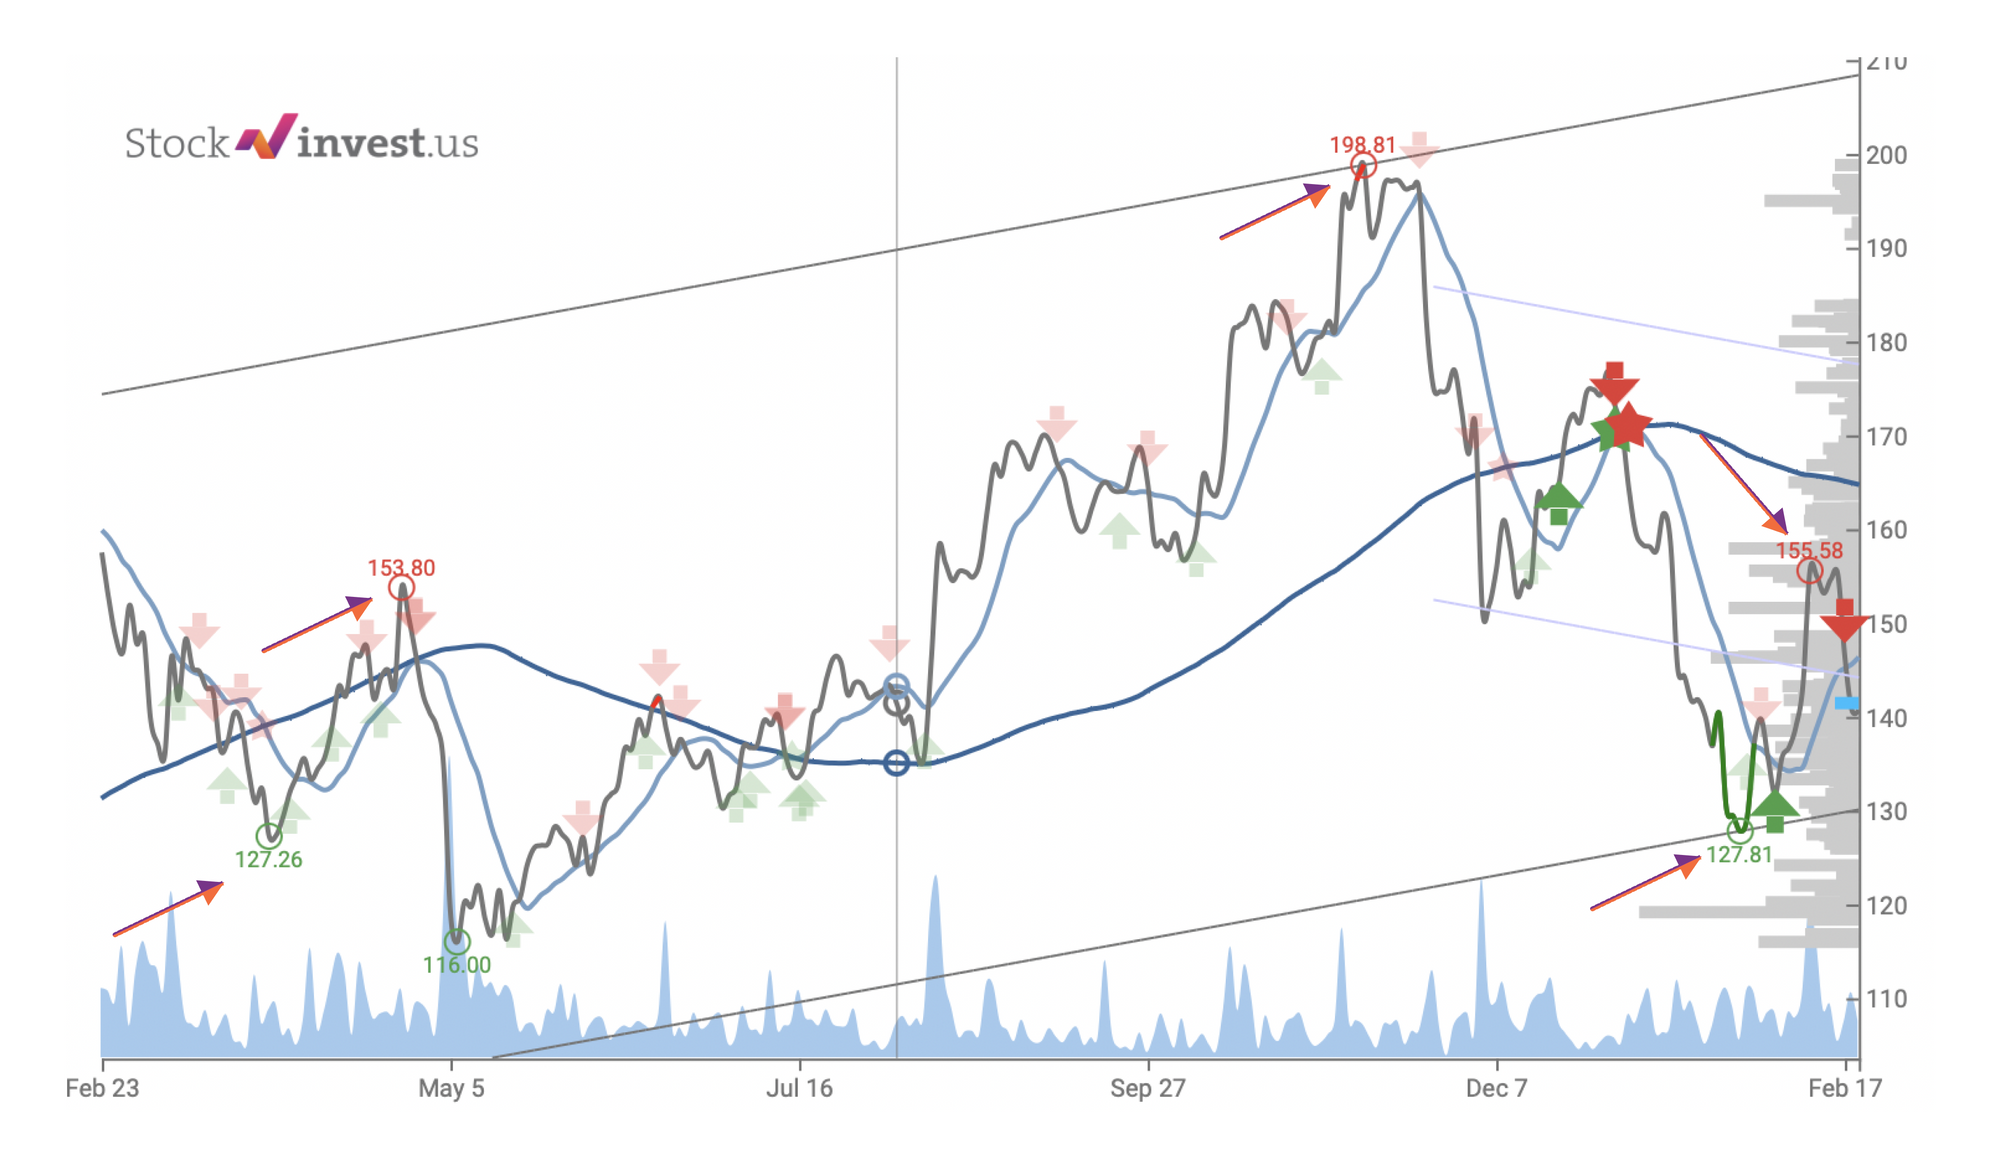
Pivot Points are marked with red or green circles in the chart above. The main rules are that the bottoms should always be lower in a falling trend, and in a rising trend, the tops should always be higher. Any deviation from these signals means possible changes and weakens any signal whatsoever.
Pivot signals are also one of the main identifiers of formations. In our chart, we use smoothed volume, so there is a slight delay, but good pivot points are followed up by volume changes. In theory, this makes sense: news hit the market, and there is a “Pivotal” change in the stock. Or that the stock reaches the level where the traders go from positive to negative, and you get a small sell-off (lots of stocks changing hands or the opposite, that there suddenly is a complete dry up). So how to trade on Pivot Points? First, you would need to set your criteria using your trading strategy. If you have decided to go for high risk, trading on Pivot Points in Apple will not make you rich. So you will look for stocks with high volatility. After identifying such stocks, you will look for those with a certain degree of predictability. Your next step is to evaluate the time of your buy and set your stop loss. We recommend that the stop loss be set no lower than the Pivot Bottom. If the stock falls lower, - the signal is invalid.
Conclusion:
- Pivot Points can be used for trading;
- Look for repetitive patterns. This reduces the overall risk;
- A change follows good Pivot Points in volume;
- In falling trends, Pivot Bottoms should continue to be lower. Any change to this is an indicator of a possible shift. The same logic applies to rising trends.


