Candlestick patterns are one of the trader's and investors' most widely used technical analysis tools. Let's find out together what it is and why traders from all over the world use them.
What is a Candlestick Pattern?
A candlestick pattern is a graphical representation of price action over a specific time, usually one day, that is used in technical analysis.
It consists of four parts:
- The body represents the difference between a security's opening and closing price.
- The wick represents the high and low prices during the period.
- The shadow represents the range between high and low prices.
- The tail is the thin line that extends from the body.
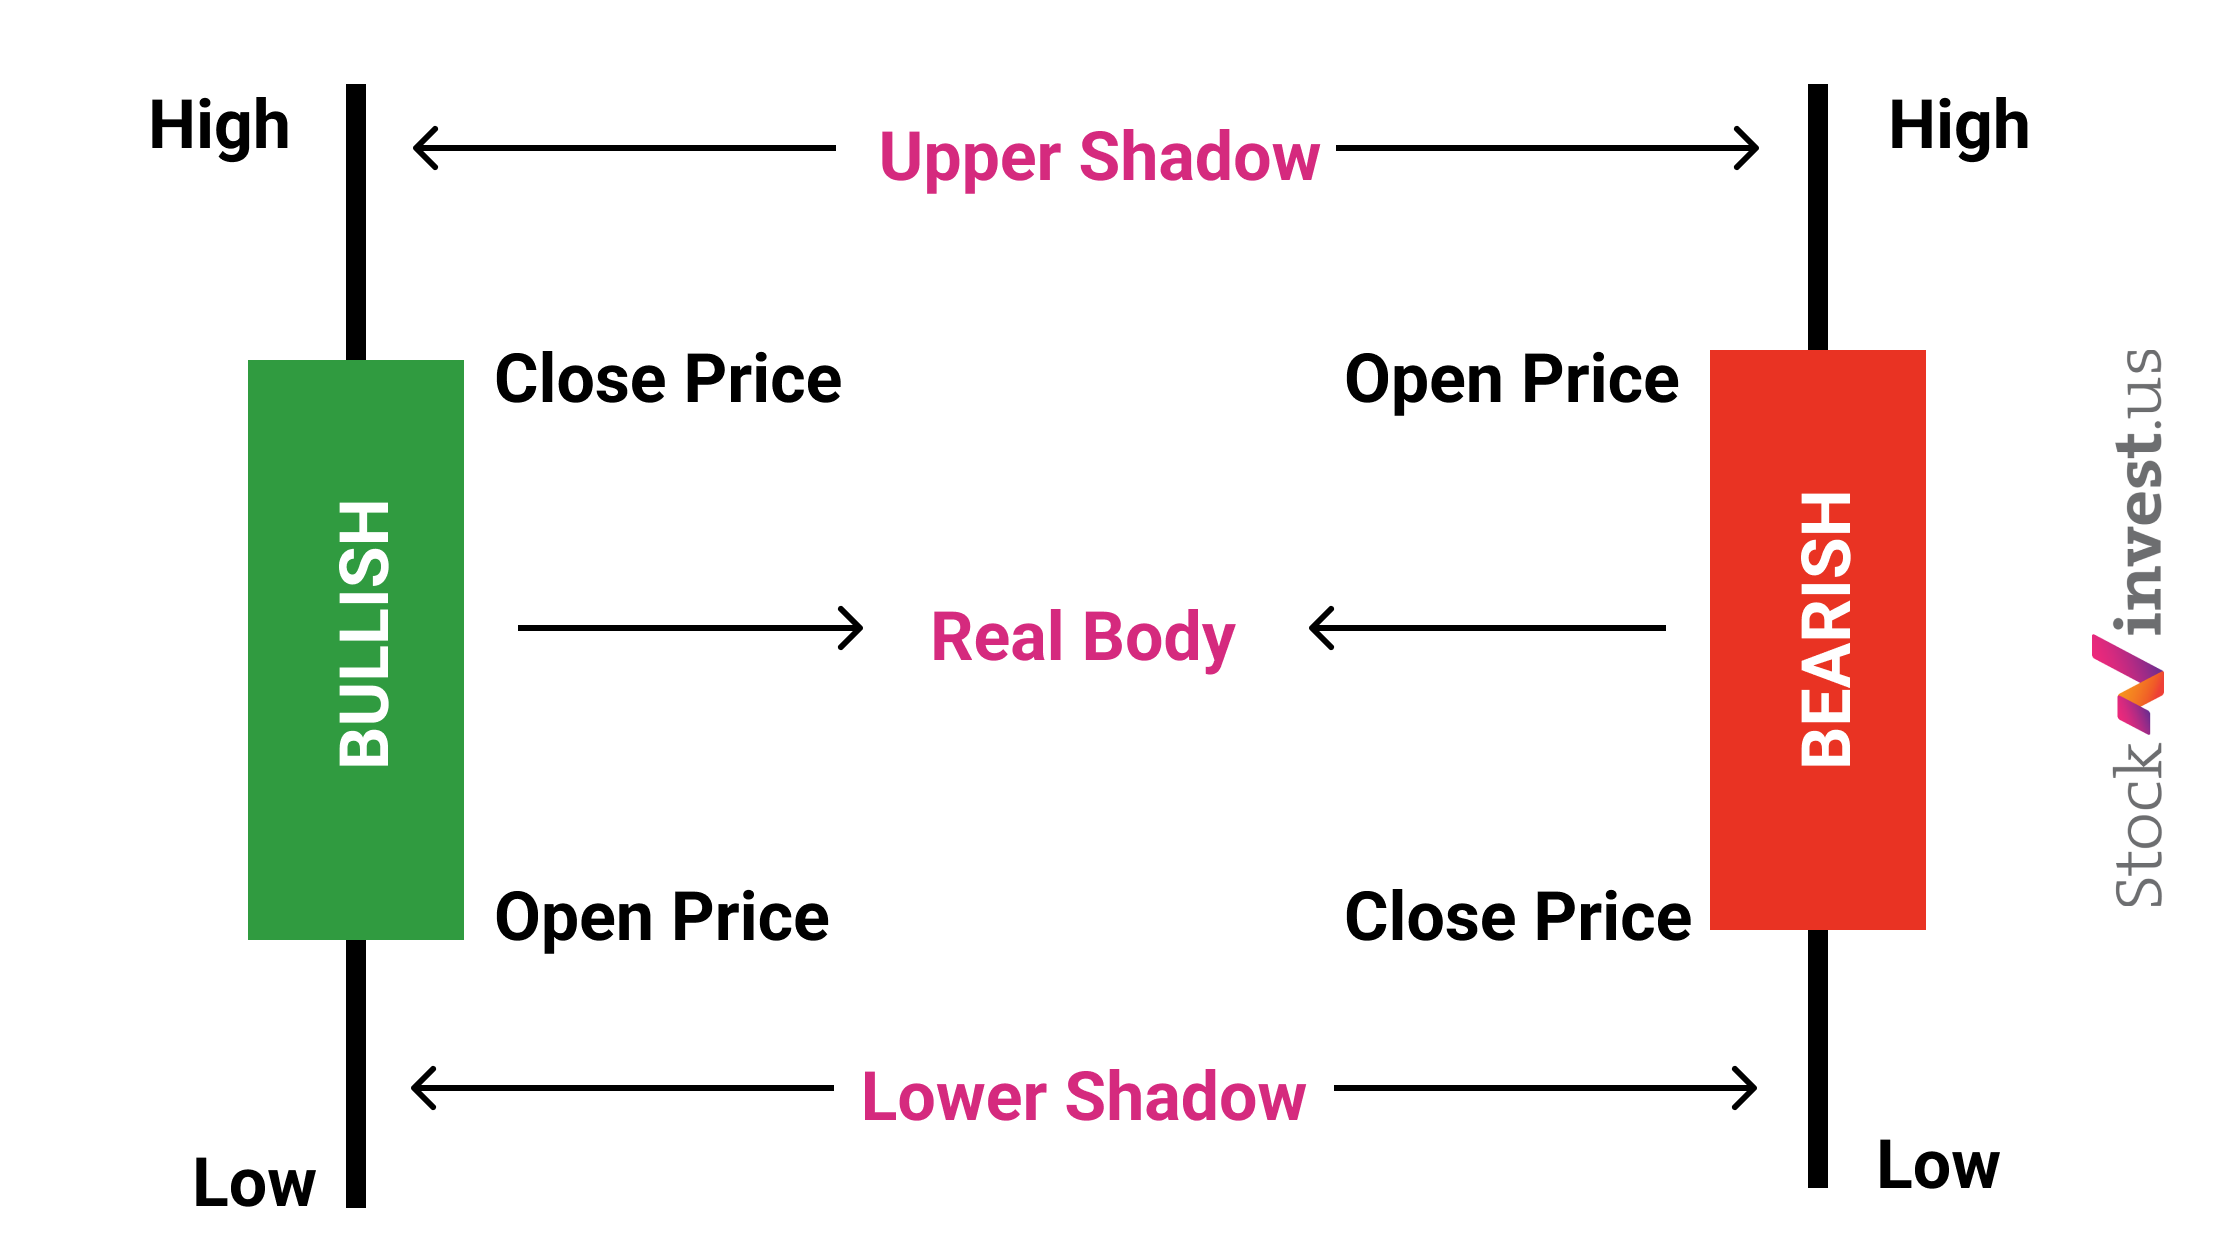
The color of the body and wick reflects market sentiment:
- Green or white bodies representing bullish sentiment (i.e., the close was higher than the open);
- Red or black bodies representing bearish sentiment (i.e., the close was lower than the open).
By analyzing the shape, size, and color of candlestick patterns, traders can gain insights into a security's supply and demand dynamics and make own decisions about buying or selling.
What is the history of Candle Charts? Briefly:
Candlestick charts have a rich history that dates back to the 18th century when Japanese rice traders first used them. Over time, they evolved into a tool for analyzing financial markets and are now widely used by traders and investors worldwide.
Candlestick charts were first introduced to the Western world in Steve Nison's book, "Japanese Candlestick Charting Techniques," which was published in 1991. Since then, they have gained widespread popularity among traders and investors and are now considered a standard tool for technical analysis.
Overview of Bullish and Bearish patterns.
Bullish patterns indicate a potential price increase and are associated with buying opportunities. In contrast, bearish patterns show a possible decrease in price and are associated with selling opportunities.
Bullish patterns include the Bullish Engulfing Pattern, Hammer, Morning Star, and Bullish Harami, among others. These patterns are formed when a small red candlestick is followed by a large green candlestick, indicating a shift from bearish to bullish sentiment.
Bearish patterns, on the other hand, include the Bearish Engulfing Pattern, Shooting Star, Evening Star, and Bearish Harami, among others. These patterns are formed when a small green candlestick is followed by a large red candlestick, indicating a shift from bullish to bearish sentiment.
It's important to note that while candlestick patterns can provide valuable insights into market sentiment, they should never be used in isolation. Traders should always consider other technical indicators and fundamental factors, such as economic data and company earnings, before making a trade. Additionally, it's crucial to use proper risk management strategies to minimize potential losses.
How to Read Japanese Candlestick Charts? Video by https://www.youtube.com/@Trading212
How to Use Candlestick Patterns in Trading?
Here are some tips on how to use candlestick patterns in trading:
- Confirm with other indicators: Candlestick patterns should not be used in isolation. Traders should always confirm the signals generated by candlestick patterns with other technical indicators, such as moving averages, trend lines, and momentum indicators.
- Look for patterns in key levels: Candlestick patterns are most effective when they form at key support and resistance levels. Traders should look for patterns at these levels to confirm a potential reversal in the market.
- Consider market sentiment: Market sentiment can significantly impact price action and should be considered when interpreting candlestick patterns. For example, a bullish pattern may be less reliable in a bearish market and vice versa.
- Use proper risk management: As with any trading strategy, it's essential to use proper risk management techniques, such as stop-losses, to minimize potential losses.
- Practice discipline: Candlestick patterns are not a guarantee of future market performance. Traders should exercise discipline and patience and not make impulsive decisions based solely on candlestick patterns.
How to combine candlestick patterns with other technical analysis tools?
Combining candlestick patterns with other technical analysis tools can provide a more comprehensive view of the market and increase the accuracy of trade signals. Here are some ways to combine candlestick patterns with other technical analysis tools:
Trend lines: Trend lines are a helpful tool for identifying the direction of the market trend. When combined with candlestick patterns, trend lines can help confirm a potential reversal in the trend and increase the reliability of trade signals.
Moving averages: Moving averages can help traders identify the direction of the trend and determine potential support and resistance levels. When combined with candlestick patterns, moving averages can help traders confirm the strength of a potential reversal in the market.
Momentum indicators: Momentum indicators, such as the Relative Strength Index (RSI) and the Moving Average Convergence Divergence (MACD), can help traders identify potential overbought and oversold conditions in the market. When combined with candlestick patterns, momentum indicators can provide additional confirmation of a possible reversal in the market.
Volume analysis: Volume analysis can help traders gauge the level of market interest in a particular security. When combined with candlestick patterns, volume analysis can help traders confirm the validity of a potential reversal in the market.
Limitations and Pitfalls of Candlestick Patterns.
Candlestick patterns can be a valuable tool for traders and investors. Still, it's essential to understand their limitations and potential pitfalls. Here are some of them.
The interpretation of candlestick patterns can be subjective, and different traders may have different opinions on the meaning of a particular pattern. This subjectivity can lead to conflicting trade signals and potential losses.
Candlestick patterns are based on past price action and can provide insight into potential future market behavior, but they are not a guarantee of future performance. It's important to understand that candlestick patterns are just one of many factors that can influence market behavior.
Candlestick patterns can generate false signals, especially in choppy or consolidating markets. Traders should always confirm signals generated by candlestick patterns with other technical analysis techniques and market fundamentals to minimize the risk of false signals.
The broader market context can influence the interpretation of candlestick patterns. For example, a bullish pattern may be less reliable in a bearish market and vice versa.
Lack of standardization. There is no standard set of candlestick patterns, and different traders may use different definitions and criteria for identifying patterns. This lack of standardization can lead to confusion and inconsistent trade signals.
We often talk and write about how important it is to develop your own strategy that will suit you. Why? There are a lot of signals and techniques, and some are better or worse for specific traders due to their limitations and risks.


