
Technical analysis (TA) is a way of analyzing the price movement of a security or derivative over time. It forecasts future price movements by studying past market data, primarily price and volume.
Many technical analysts believe that patterns repeat themselves in financial markets. And it can be helpful in future price change predictions.
Such a method has evolved for many years as traders have come up with new ways to analyze the markets. This article will take a closer look at technical analysis and discuss some of the signals technical analysts use to make trading decisions.
How does technical analysis work?
Technical analysis is based on the belief that markets have a tendency to repeat themselves. So, by studying past market data, technical analysts try to identify patterns that can be used to forecast future price movements.
There are many different technical indicators and tools that traders can use. It operates from the assumption that all relevant information is already reflected in the price of a security. That price movements are therefore primarily driven by changes in investor sentiment.
With technical analysis, you can generate short and long-term signals determined by the length of the study period. Fundamental traders often use technical analysis to better time the trade as technical analysis can be used to identify support and resistance levels along with a lot of indicators to identify current momentum and trend.
It is important to remember that technical analysis is not an exact science, and there is no one technical indicator or tool that can generate perfect buy or sell signals. However, technical analysis, done well, can certainly improve your profitability as a trader. And this is the only analysis method that allows you to analyze thousands of companies daily.
Some common technical indicators that traders use include Moving averages, Relative Strength Index (RSI), Bollinger Bands, MACD, and many more. We will discuss each of these technical indicators in more detail below.
Shortly about technical analysis history.
The origins of technical analysis can be traced back to the 18th century, when Japanese rice traders started using candlestick charting to predict changes in rice prices.
Candlestick charts are still used today and are one of the most popular technical tools among traders. In the 19th century, technical analysis was introduced to the Western world by Charles Dow, who is considered to be one of the fathers of technical analysis.

Dow developed several key concepts that are still widely used today, such as support and resistance levels, trend lines, and market cycles. Since then, technical analysis has evolved significantly, with traders developing with new ways to analyze the markets.
What are technical analysis indicators?
As we mentioned earlier, technical analysts use a variety of technical indicators and tools to help them make trading decisions. Some common technical indicators that traders use include:
- Moving averages
- Relative Strength Index (RSI)
- Bollinger Bands
- Volume
- Pivots and Fibonacci Numbers
- MACD (Momentum Indicators)
- Support and resistance levels
We will discuss each of these technical indicators in more detail below.
Moving averages:
A moving average is a technical indicator that is used to smooth out price action and help traders identify the trend. Moving averages are calculated by taking the average of a security's price over a specific time, typically 20, 50, or 200 days.
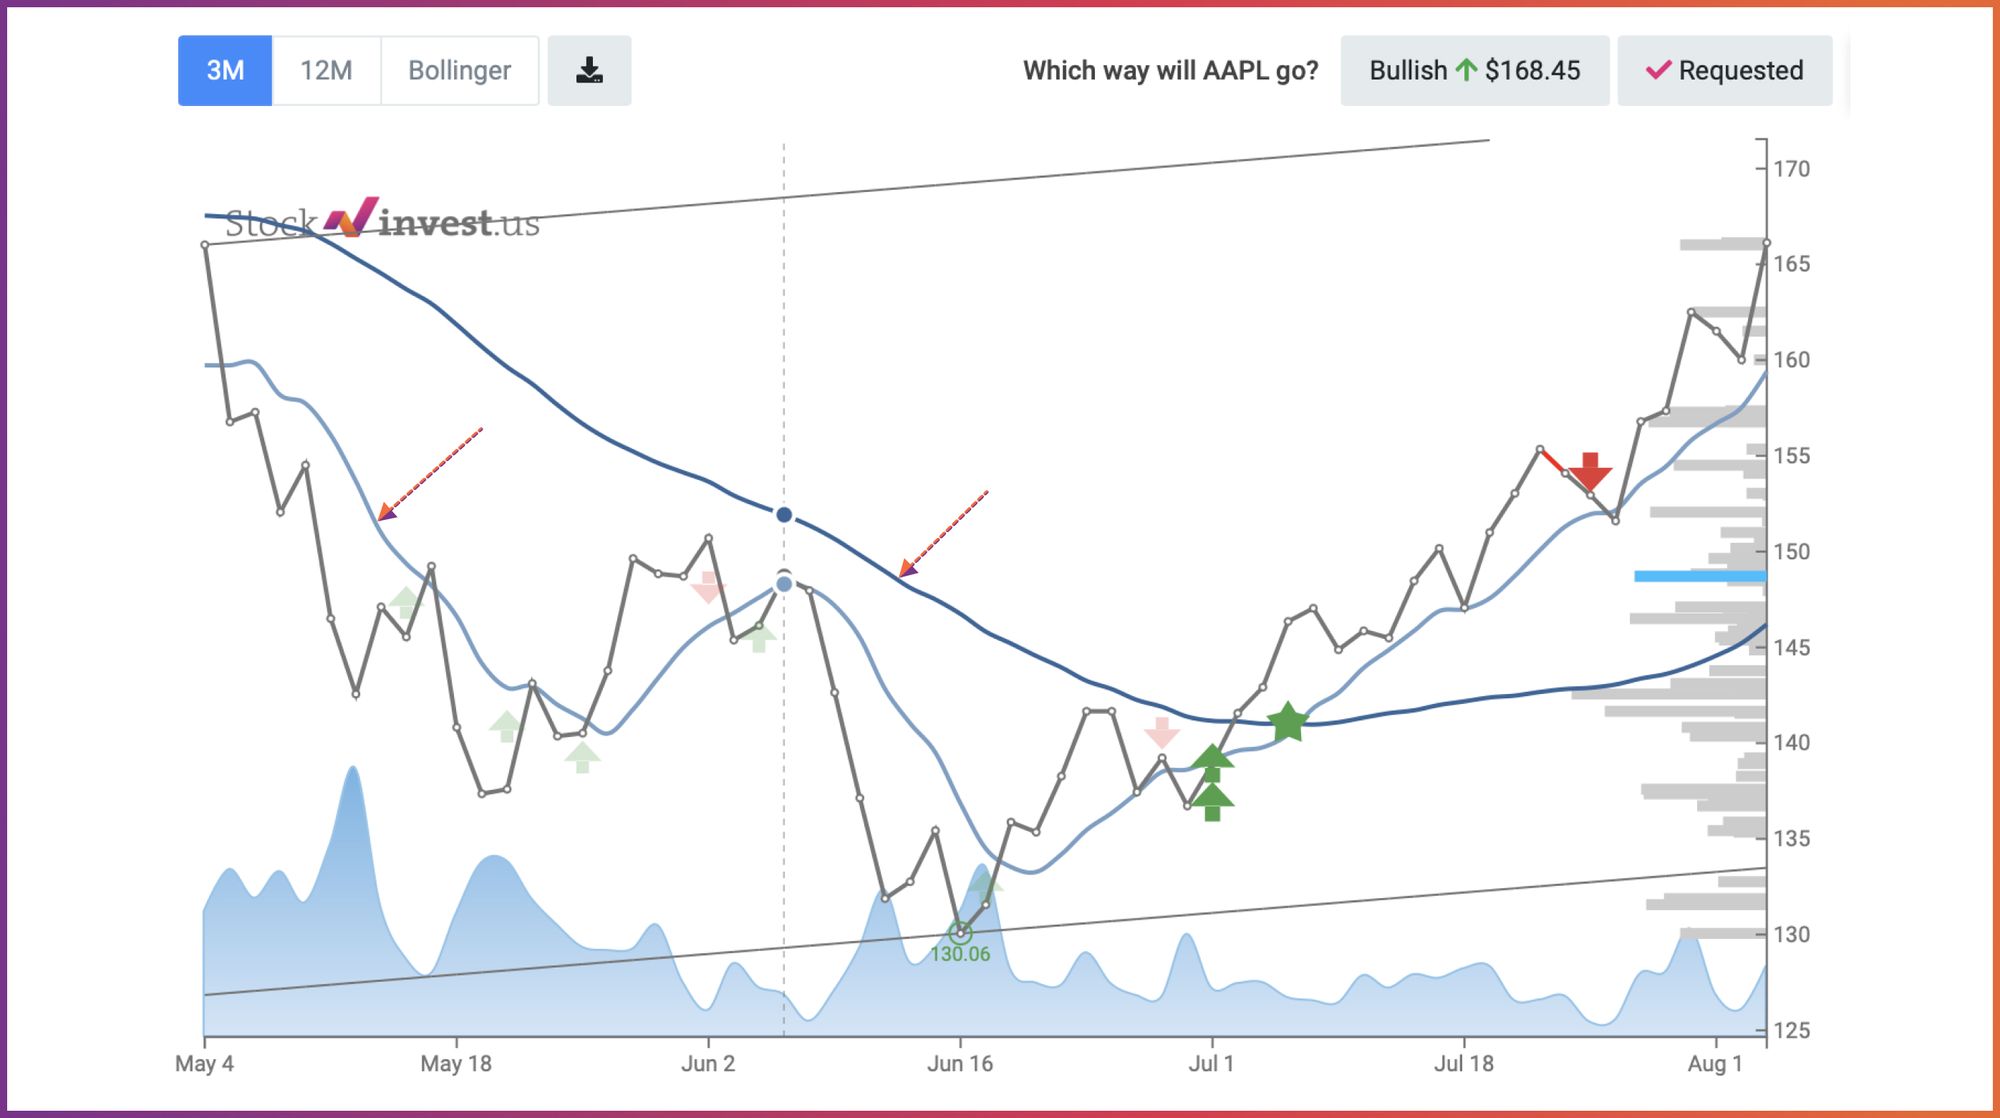
The main disadvantage is that they can lag behind the price, which means that they may not give you an early signal of a change in trend.
There are different types of moving averages, such as simple moving averages, exponential moving averages, and weighted moving averages. Simple moving averages give equal weight to every data point, while exponential moving averages give more weight to recent data points.
Weighted moving averages are similar to exponential moving averages but with less weight given to recent data points.
We have a separate article about Moving Averages, which you can read here.
Relative Strength Index (RSI):
The Relative Strength Index (RSI) is a technical indicator that measures the speed and change of price movements. The RSI oscillates between 0 and 100, with readings below 30 indicating oversold conditions and above 70 indicating overbought conditions.
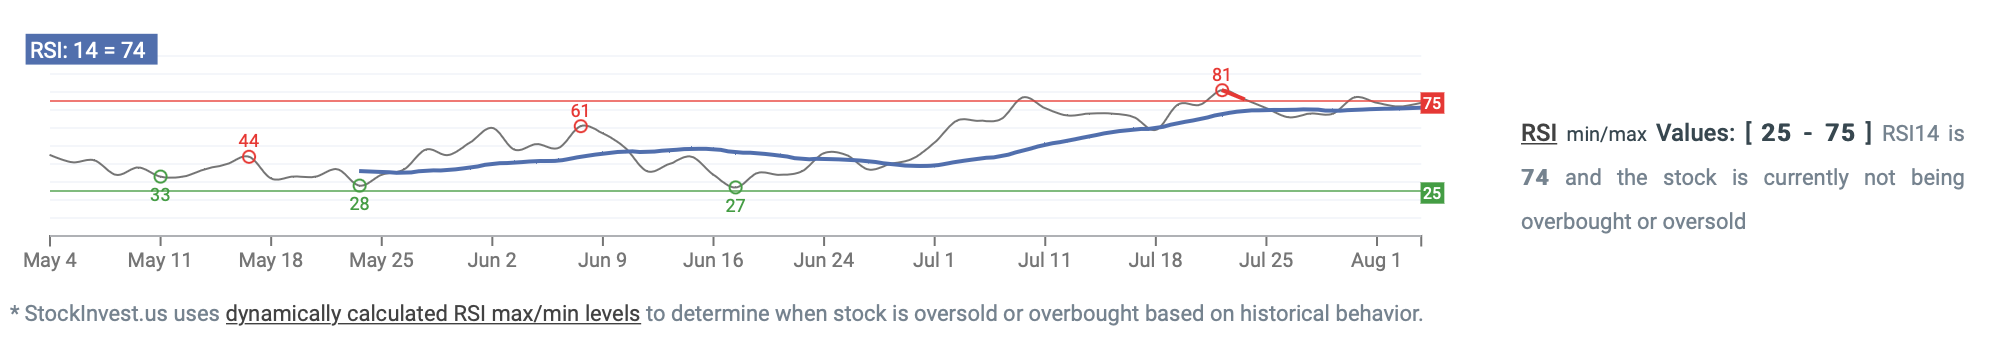
The main advantage of using the RSI is that it can help you identify overbought and oversold conditions in the market. This can help decide when to enter or exit a trade.
Bollinger Bands:
John Bollinger created this indicator in the early 1980s. Its purpose is to define price action relative to the assets' highs and lows.
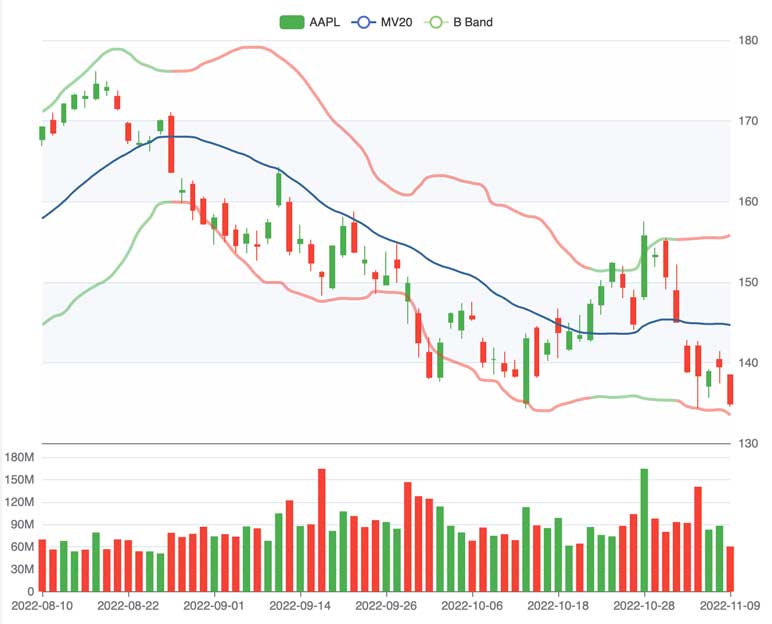
It consists of three curves drawn in relation to securities prices. The middle band is a measure of the intermediate-term trend, usually a simple moving average, that serves as the base for the upper and lower bands. The interval between the upper and lower bands and the middle band is determined by volatility, typically the standard deviation of the same data that were used for the average. StockInvest.us uses Bollinger's suggested 20-day average.
Volume:
Volume is the number of shares or contracts traded in a security or market during a given time. It is one of the essential technical indicators as it can help confirm trends and reversals.
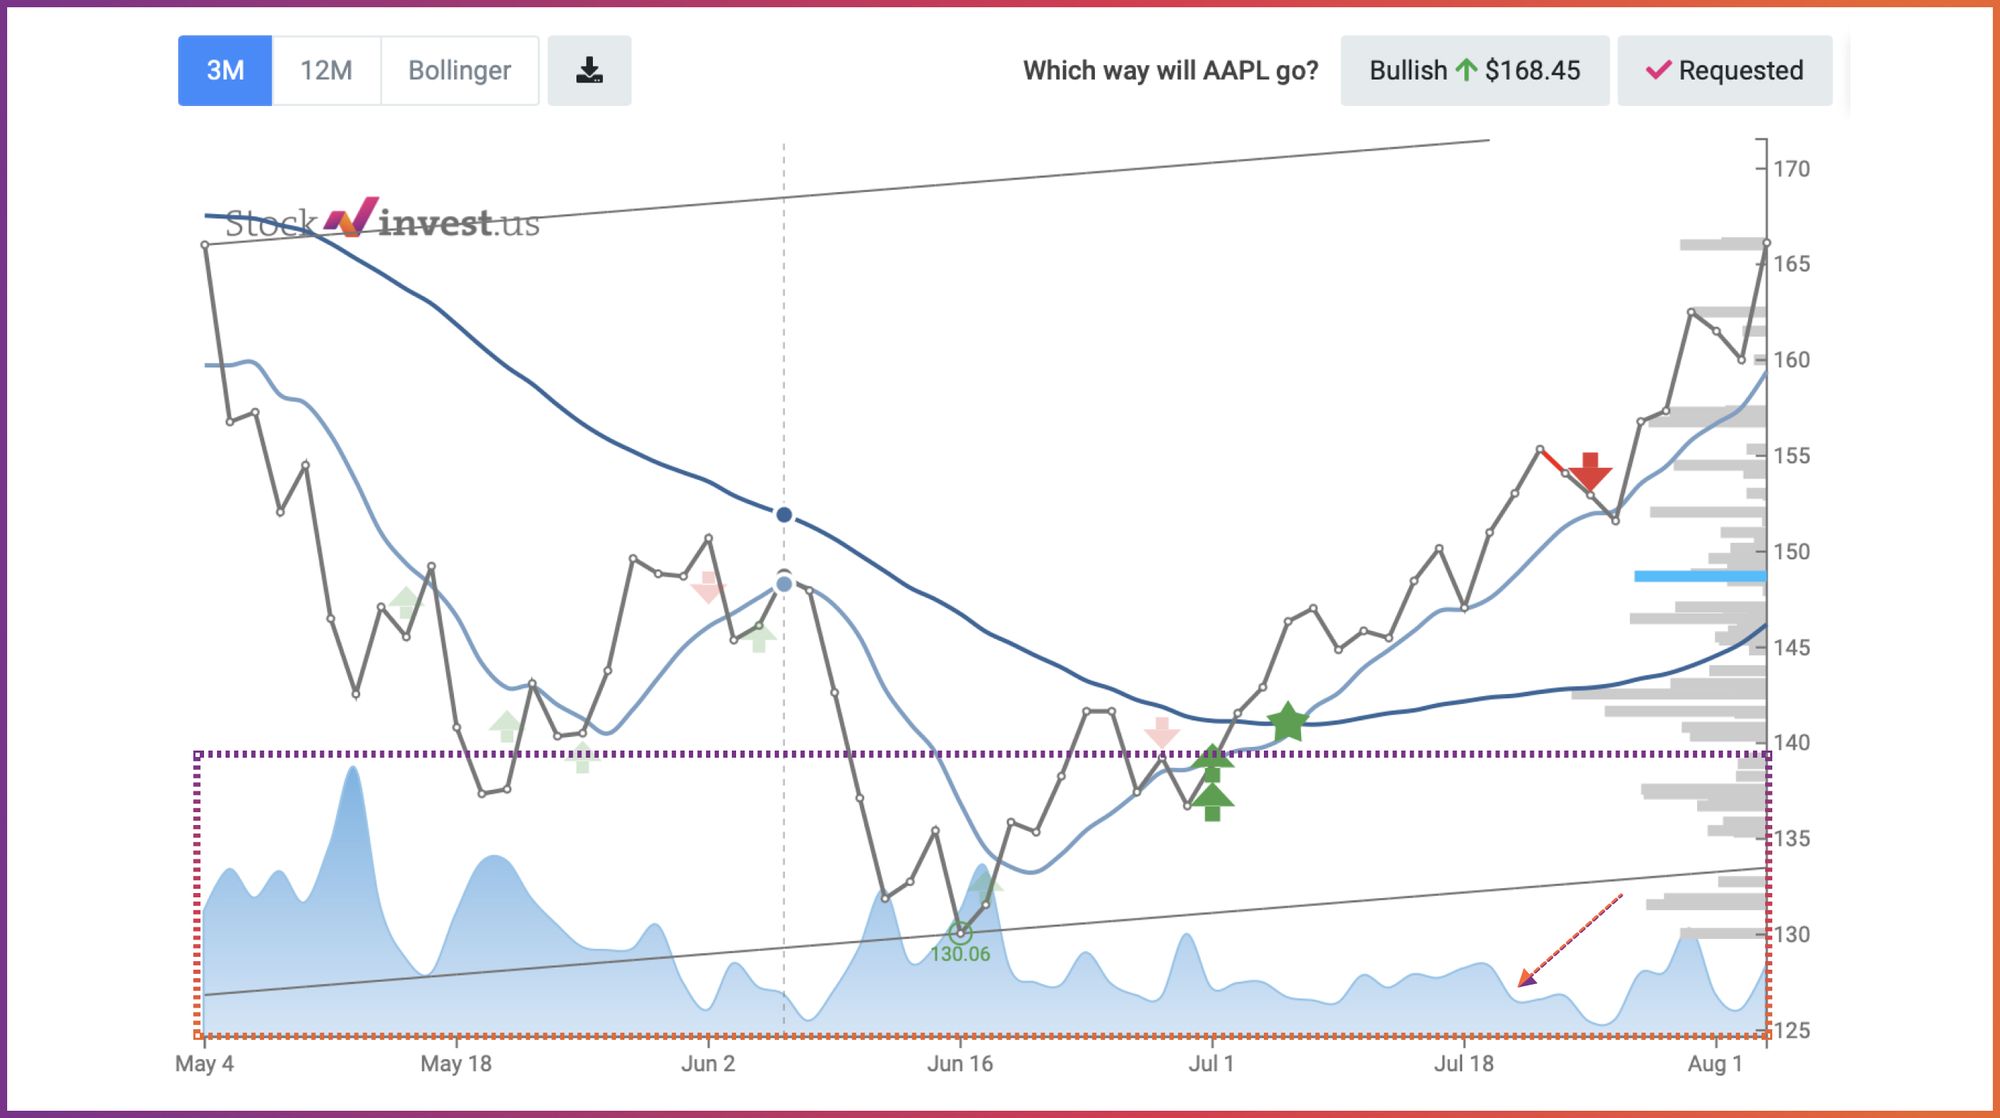
For example, if the price of a stock is rising but the volume is decreasing, this could be a signal that the trend is losing momentum and may reverse soon. And vice versa, if the price is falling, but the volume is increasing, this could be a sign that the selling pressure is weakening, and the stock may soon start to move higher.
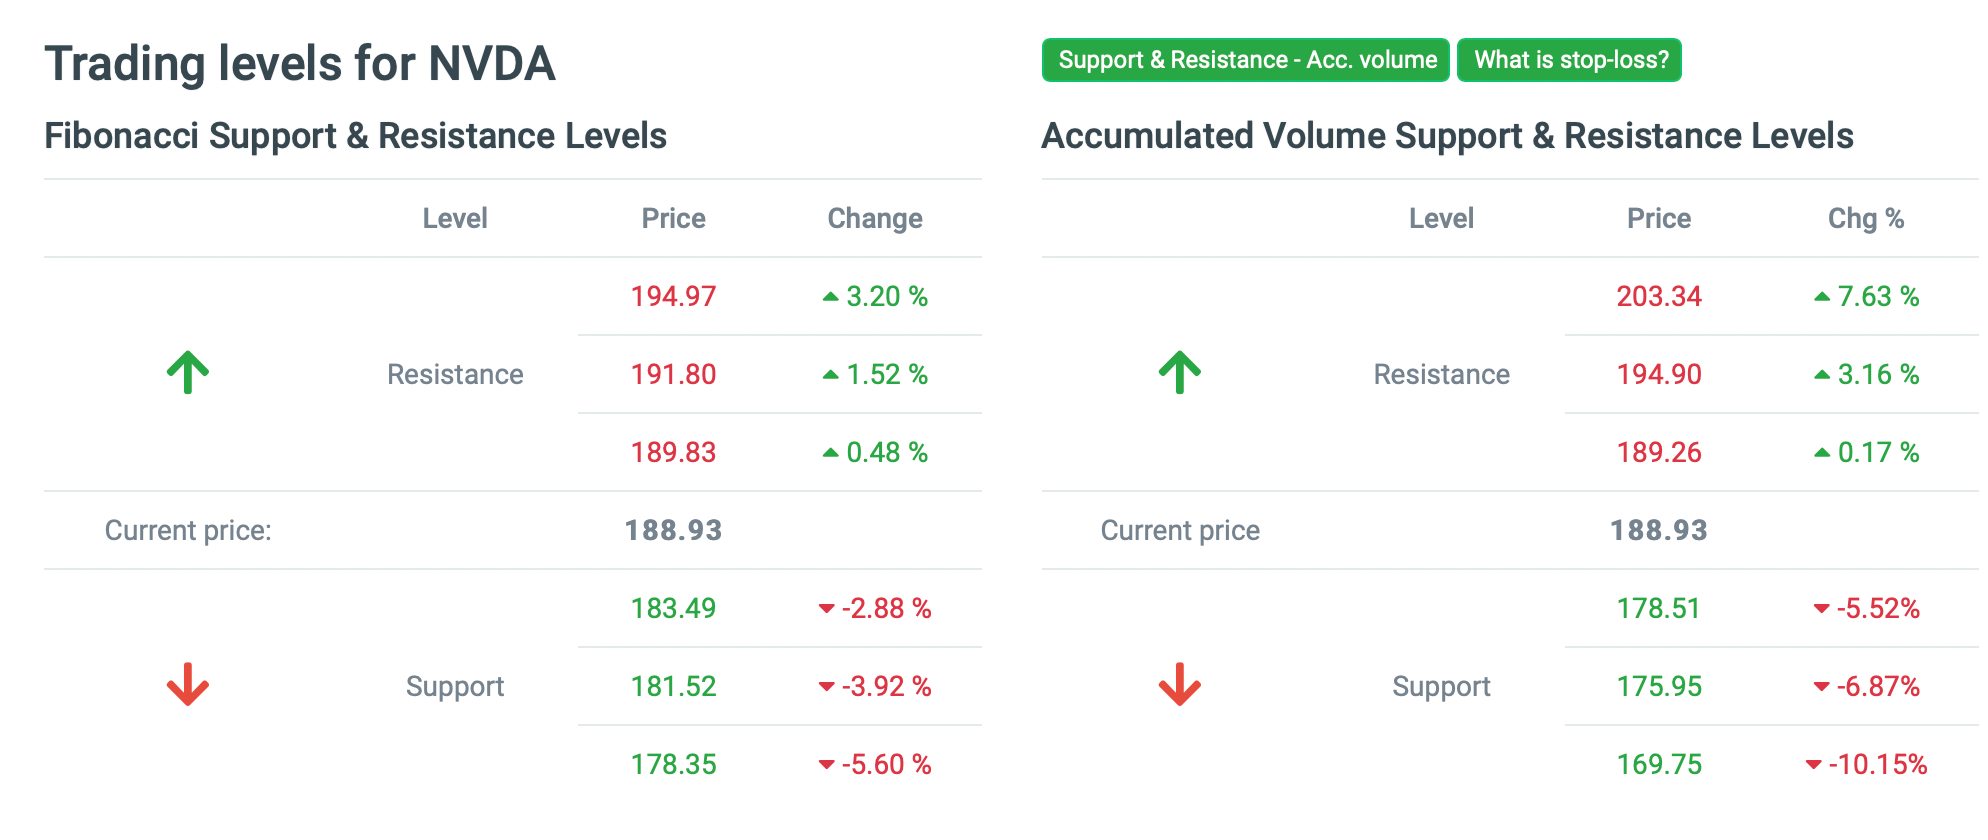
Pivots and Fibonacci Numbers:
Pivot points and Fibonacci numbers are technical indicators that are often used together. Many traders use these two to identify price levels for entering or closing out trades.
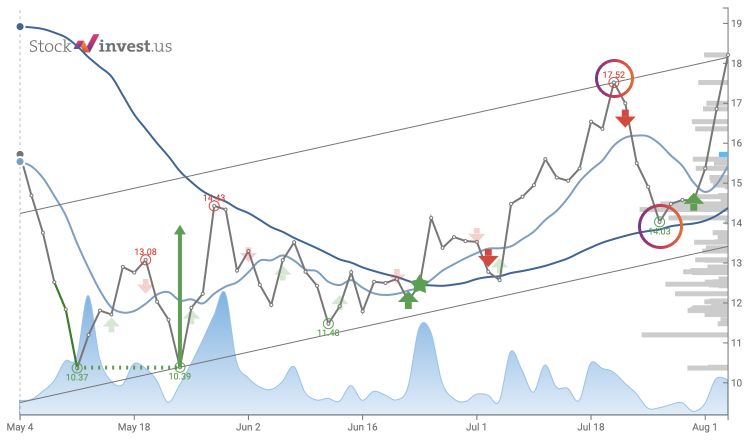
Pivot points are calculated using a security's high, low and close prices over a certain period, typically daily or weekly.
Fibonacci numbers are technical indicators that are used to identify potential support and resistance levels. Fibonacci numbers are based on the Fibonacci sequence, which is a series of numbers where each number is the sum of the two previous numbers. The most popular Fibonacci ratios used in trading are 23.60%, 38.20%, 50%, and 61.80%.
MACD (Momentum Indicators):
The MACD (Moving Average Convergence Divergence) is a technical indicator that measures the difference between two moving averages. The MACD is calculated by subtracting the 26-day exponential moving average (EMA) from the 12-day EMA.
The MACD is a momentum indicator that helps you identify when a stock is overbought or oversold. It can also be used to confirm trends and reversals.
Technical Analysis vs. Fundamental Analysis.
The technical analysis methodology uses price change charts, patterns, and signals. This technique allows predicting price changes in the future by analyzing past and current position price changes. It is based on the analysis of time series of prices, most often charts with different timeframes.
Fundamental analysis is based on studying the company's economic, financial, and production indicators and their investment attractiveness. A trader should do all this to determine securities' real or "fair" value with a high degree of certainty.
Fundamental analysis works better in the long term - weeks, months, and even years. And technical analysis can be applied even for periods of a few minutes. Therefore, an investor should pay much attention to fundamental analysis when planning a portfolio for the long-term - months and years.
It is impossible to say which is better - fundamental analysis or technical analysis with complete certainty. Both works according to their laws and have their limits of applicability. Based on technical analysis, it is impossible to build a forecast for several years ahead. At the same time, the fundamental analysis considers the market's psychology to a limited extent and will not allow predicting spontaneous hype or panic selling.
Technical analysis is the only method that can help you analyze thousands of stocks a day. When combined with a detailed study of the macro and micro climate of the company of interest, it can help find profitable solutions. The charts will help you find the optimal entry point: you need to select an asset and wait until the patterns predict an upward trend reversal.
The choice of methods depends on your strategy. You can focus on charts if you plan to work on short time intervals. Fundamental analysis takes time and calculations and can still fail due to unexpected news. But it will allow you to keep abreast of the situation in the industry and warn about "junk" low-liquid assets of unreliable issuers.
Technical Analysis Limitations.
One technical analysis limitation is that it primarily focuses on price and volume data. This information can be easily manipulated. For example, a company could artificially inflate its stock price by buying back its shares or by paying people to trade the stock. This would increase the volume of trades and make it appear as if there is more interest in the stock when there may not.
Another technical analysis limitation is that it assumes that all market participants are rational and that they all have access to the same information. However, this is not always the case. Some market participants may have insider information or access to better research than others. This can give them an advantage over other market participants who do not have this information.
Technical analysis also has trouble dealing with news events. These events can cause significant price movements that technical analysis may not predict. For example, a company might announce a very successful new product. This would cause the stock price to go up, but the technical analysis could not to predict this event.
It is important to keep these limitations in mind when using technical analysis. Technical analysis should not be the only tool used to make trading decisions. Fundamental analysis and other tools should also be used to get a complete market picture.
Summary.
Traders and investors have used technical analysis for centuries as a way to try and predict future price movements in the markets. It has its advantages and, of course, disadvantages.
Here at StockInvest.us, we use technical analysis as a core of our algorithms, which help us to analyze thousands of stocks daily. However, we always add other aspects that help users make their strategies.
We also believe that fundamental analysis and other tools should be used to get a complete picture of the market.
Thank you for reading, and stay tuned for more!


