
In this article, I will argue that Golden Star™ is better than most signals derived from moving averages. Why? Because it focuses on the optimal buying point in combination with the strength of the well-known Golden Cross signal given by using two moving averages.
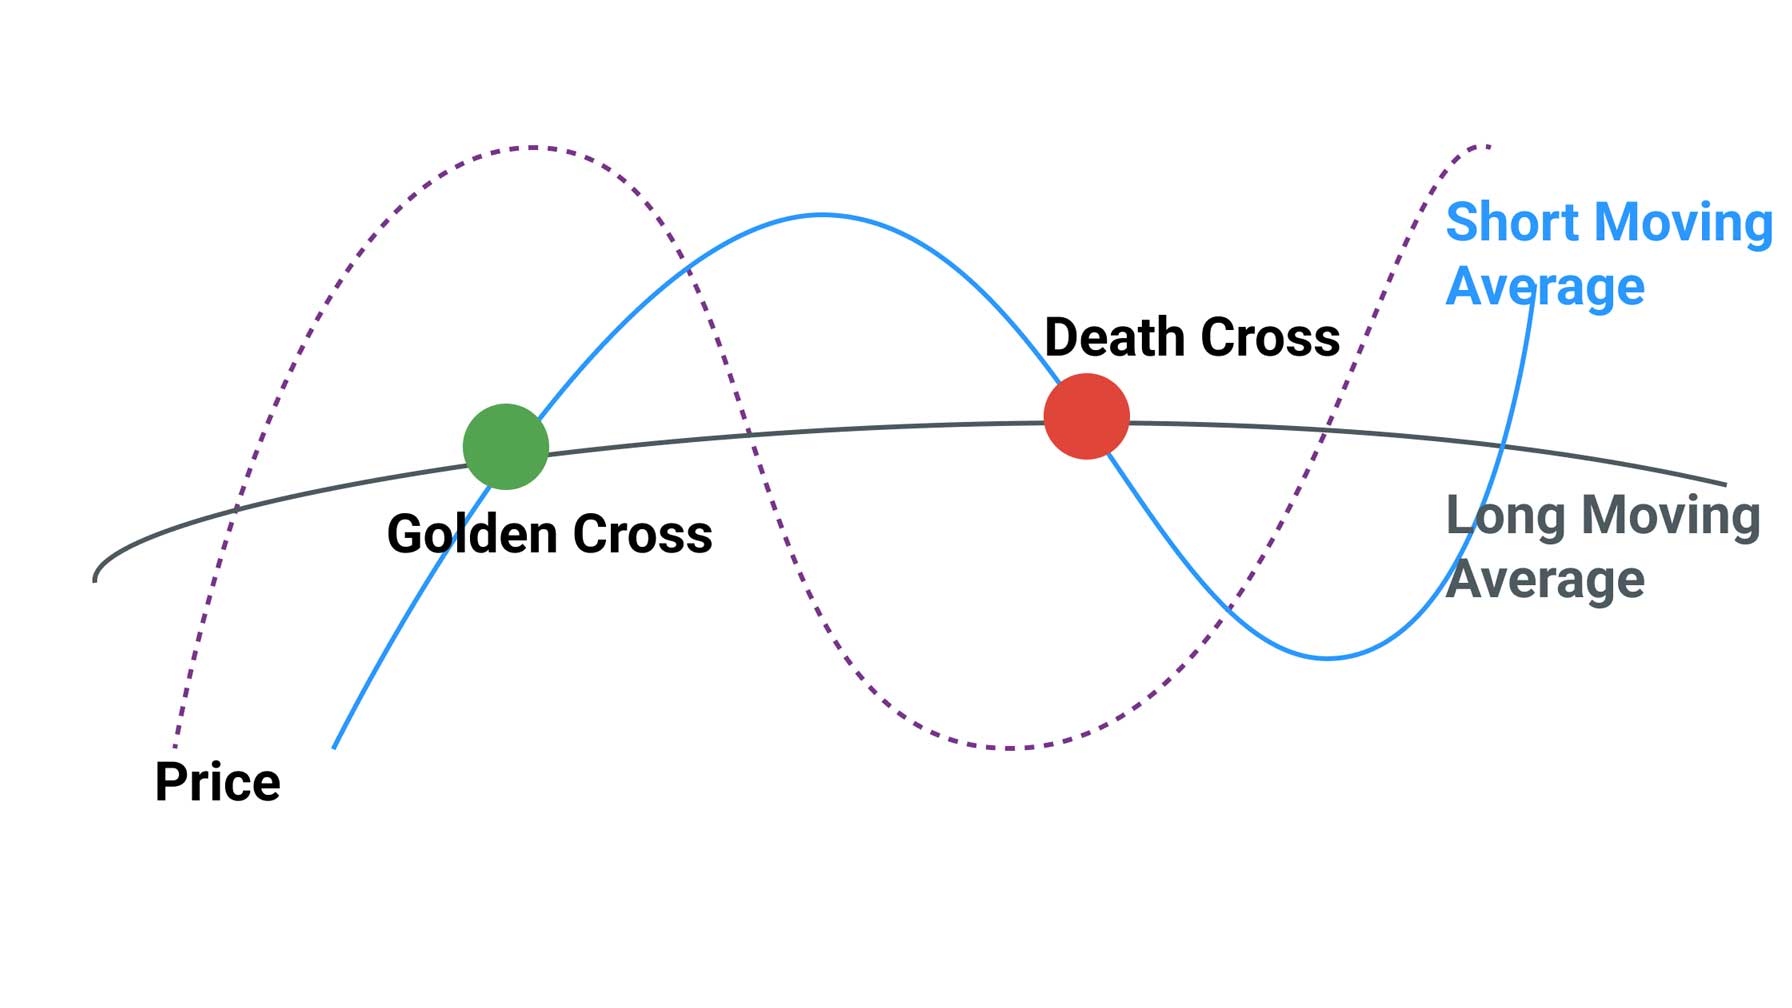
Before starting, it is essential to know the distinct differences between a Golden Cross and a Golden Star™. The first refers to the standard signal derived from two selected moving averages (short and long) crossing each other. At the same time, the Golden Star™, discussed in this article, is an enhanced version of the Golden Cross.
The Golden Star™ was invented and presented to the public by the author of this article in 2007. To show you the usefulness of this signal for a trading strategy, let's talk about the following:
- What are moving averages?
- Why may moving averages fail as a trading strategy?
- General understanding of the concept of using moving averages.
- How to improve the moving averages?
- The birth of the Golden Star™ Signal.
- The fails and the flaws of the Golden Star™
- What makes Golden Star™ a better signal than other signals from moving averages?
Furthermore, I will give insights into the history and reasoning behind the Golden Star™ signal and discuss the weaknesses and strengths of using moving averages and Golden Star™ in a trading strategy.
What are Moving Averages?
According to Wikipedia, moving average (hereafter also referred to as MA) are:
? "A moving average is commonly used with time series data to smooth out short-term fluctuations and highlight longer-term trends or cycles.
The threshold between short-term and long-term depends on the application, and the moving average parameters will be set accordingly.
For example, it is often used in technical analysis of financial data, like stock prices, returns, or trading volumes. It is also used in economics to examine a gross domestic product, employment, or other macroeconomic time series. Mathematically, a moving average is a type of convolution. So it can be viewed as an example of a low-pass filter used in signal processing. When used with non-time series data, a moving average filters higher frequency components without any specific connection to time. However, typically some kind of order is implied. Viewed simplistically, it can be regarded as smoothing the data."
For the common investor, the moving average is most known and perceived as a price trend indicator and is often shown in charts, as shown in the example below.
Why may Moving Averages fail as a trading strategy?
The term moving averages dates to the beginning of the twentieth century and falls under the category of "time series analysis."
? The term "Moving Averages" was used by RH Hooker in 1901 but first appeared in public circulation in W. I. King's Elements of Statistical Method (1912).
Moving averages were later introduced into the world of technical analysis in stock trading and are today one of the traders' most used signals/indicators.
The moving average is a lagging indicator, and most will argue that it best describes a general trend, as it is smoothed and hence reduces the overall noise that price swings represent. However, using "averages" to determine an item's correct price/value is as old as humankind.
The basic understanding of an "average" is that a buying opportunity occurs when prices are below the average price line, while it is the opposite for "moving averages" used in trading. Here the moving average below the price lines is interpreted as a buying opportunity.
? However, both say the same: any average, moving or standard, will eventually cross the price line. And the optimal buying or selling point will vary, and there should not be a standard definition.
Understanding it is vital because it highlights the exceptional need for timing to make a strategy based on moving averages successful.
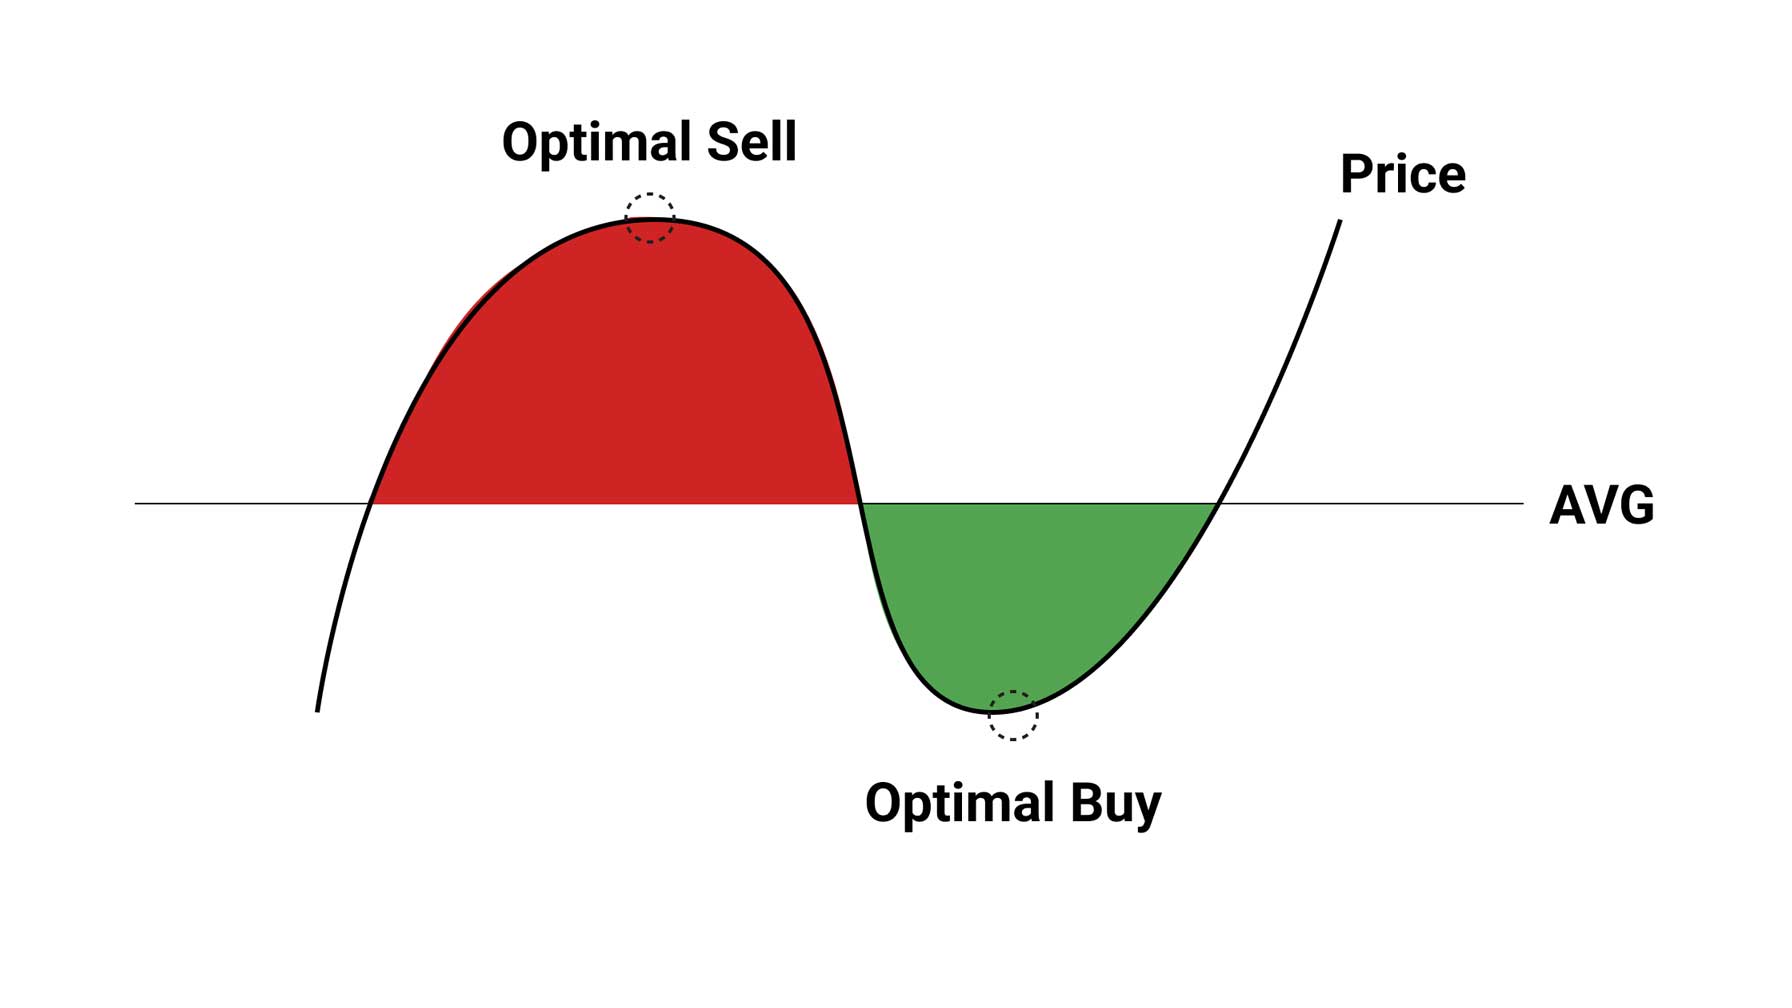
Let's take a look at the illustration above. In this situation, we use a standard average for a stock moving horizontally. In this case, the optimal selling point is when the price reaches the highest point above the average. And the optimal buying point is when the price is at the lowest from the moving average.
However, as we remember, the traditional understanding and use of "moving averages" in trading are the opposite.
?You buy when the moving average is below the price and sell when it is above.
The main argument for using an opposite approach with moving averages is that it helps to understand the underlying trend. However, as stated before, the simple average illustrates the critical issue of timing.
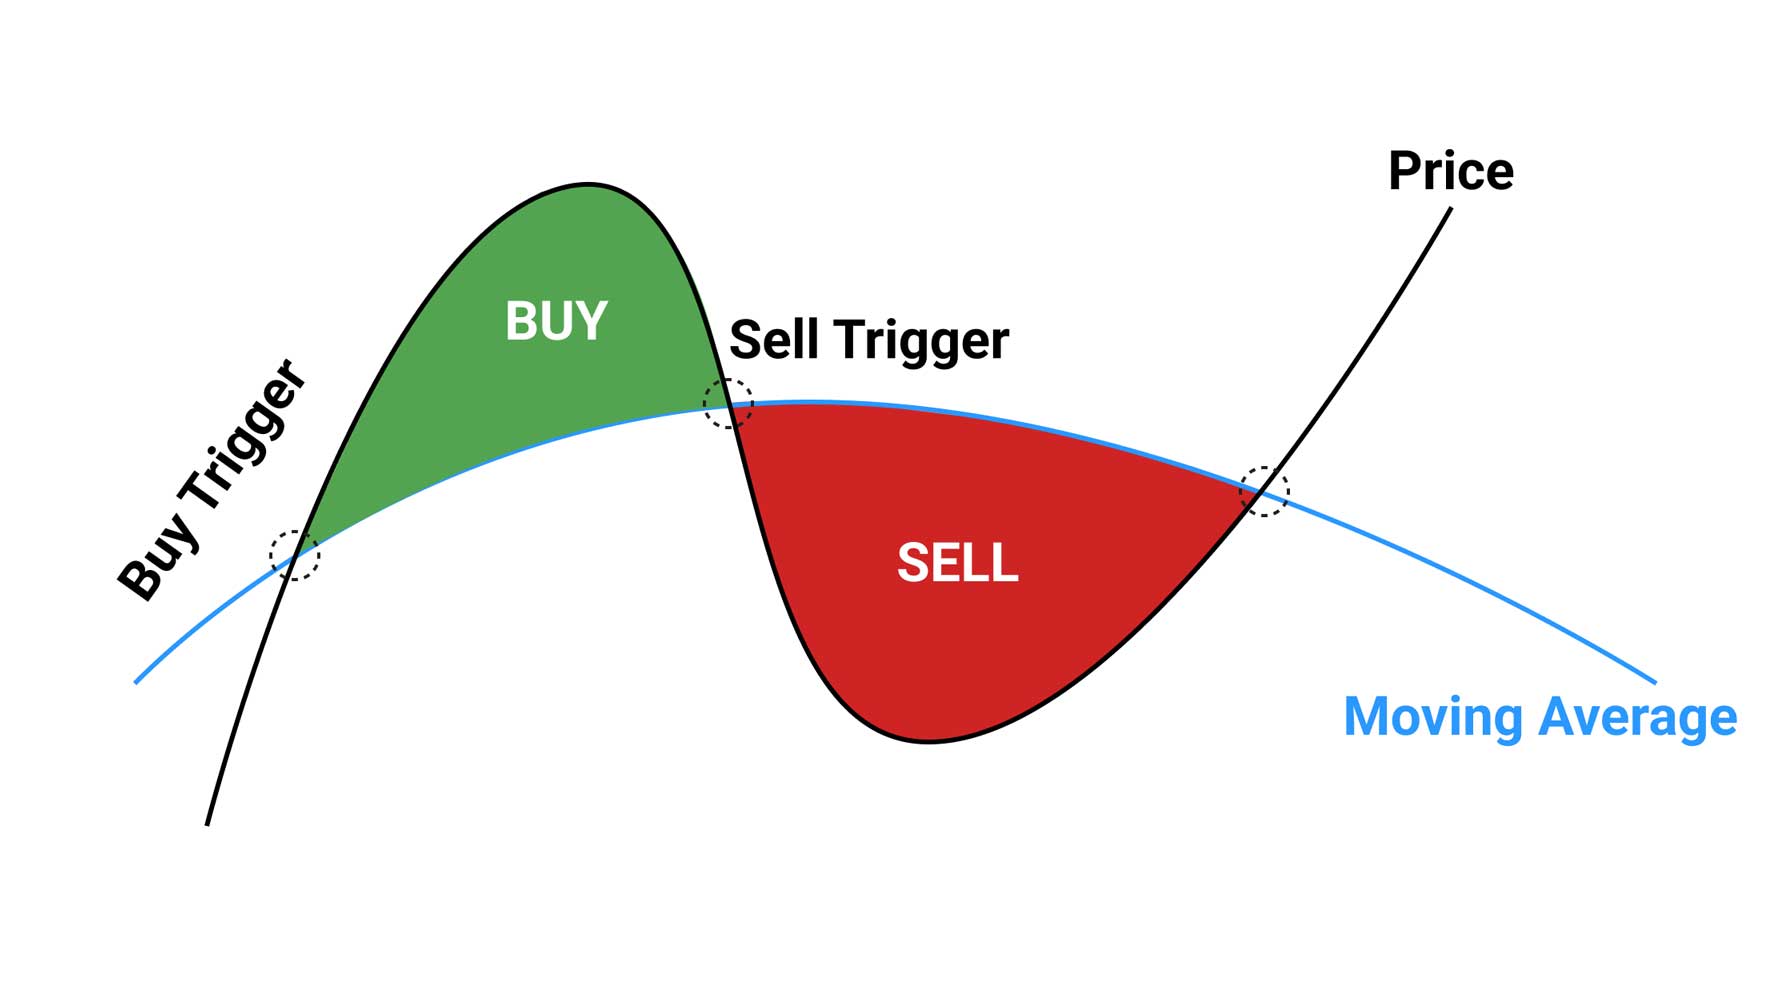
In traditional trading using moving averages, the execution time is the point when the price crosses the moving average. However, looking at the illustration below, it becomes clear that you can lose out of substantial profit using this method and, in the worst case, lose money.
We need to understand the number of conditions tied to using moving averages. These conditions are described in articles like "The seven pitfalls of moving averages." Some of the conditions that apply are:
- Using the correct period
- Trend
- Type of instrument
- Volatility
- Liquidity
?In addition, the moving average is a lagging indicator, meaning that it is based on history.
Sudden news or drastic changes for the company/stock or even the market can cause significant changes that a lagging indicator, like the moving average, will use the time to reflect. The news can be anything from contracts to major political events.
Some people argue that the risk can be further smoothed. And you can strengthen the signal by using combinations of two moving averages: one short and one long, to produce the Golden Cross. However, critical voices argue that there needs more to gain from using moving averages as a strategy.
In 2019 Reuters ran the article "Golden cross for stocks does not always glitter," where the research concludes that buying the index would give the same return with less hassle.
In most cases, a failing strategy is due to a general lack of knowledge about moving averages and the following conditions and limitations. This often leads to using the wrong period and not initiating the sell early enough. It would help if you remembered that moving averages are one of the best trading indicators and signals, along with volume indicators, if used correctly.
Building a general understanding of moving averages.
Let's agree that the moving average is a lagging indicator that is subject to the general movements in the stock. We can extract a few vital fundamental conditions for using them in a trading strategy.
- The moving average must be adjusted to the period it is based on;
- Also, it has to be adjusted for the volatility and liquidity of the stock;
- The trend will determine the success of using moving averages;
- The use of MA in a trading strategy requires an understanding of the limitations and conditions that apply.
Adjusting the Moving Averages to reflect the period better.
The moving average should reflect this if you are using a short time frame for your trading. Otherwise, it will not trigger signals often enough to make your trading efficient.
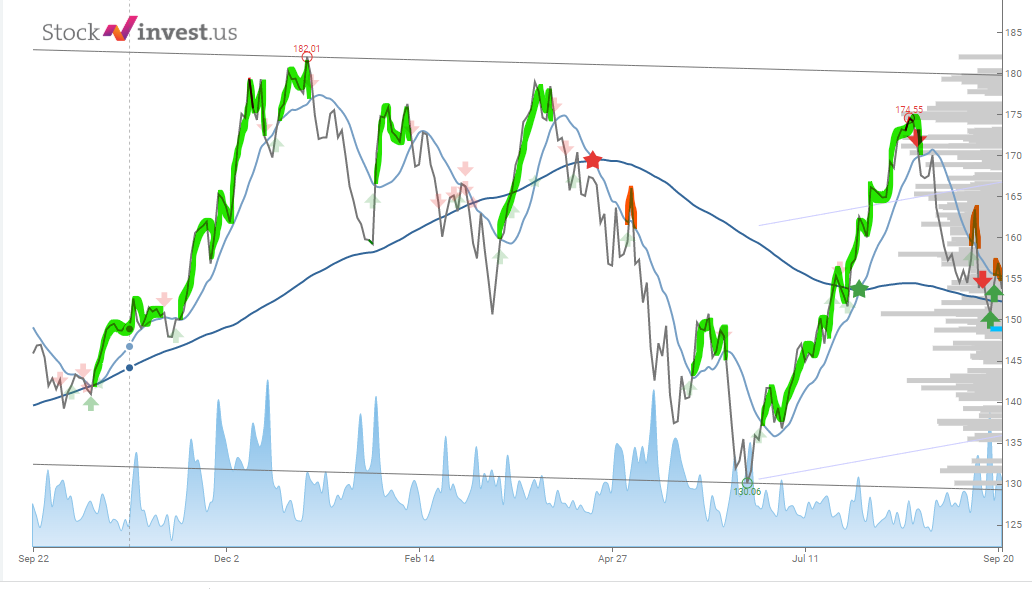
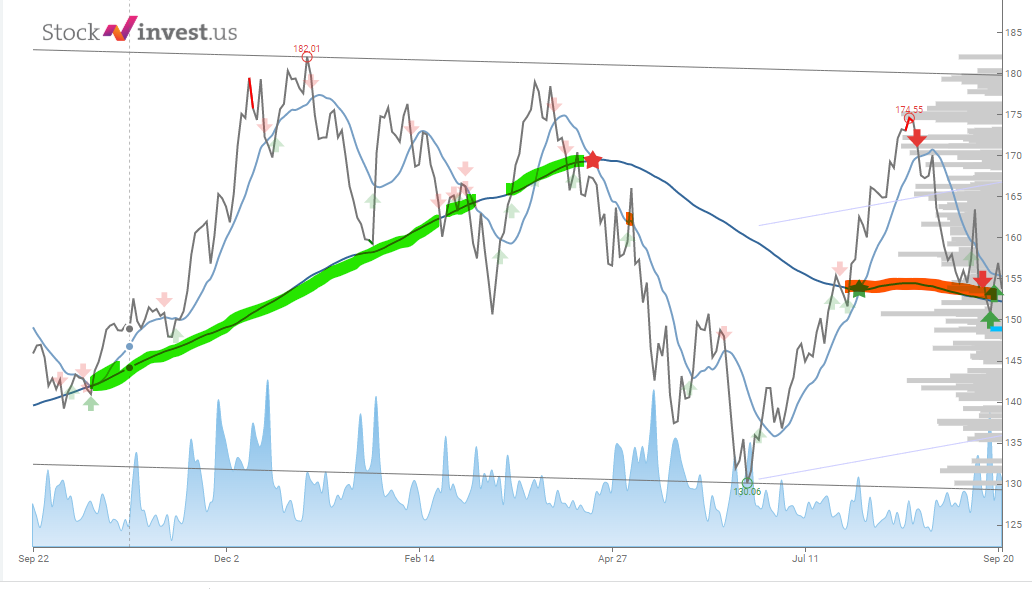
Below are two images showing Apple's [AAPL] chart for12 months (Sep 2021 – Sep 2022). If we make the easiest assumption of buying when the moving average breaks the price down and selling when it breaks up, we will see the importance of selecting the correct MA.
Let's take a closer look at the chart. The light blue line shows the moving average of 35 days (hereafter referred to as MA-35). And the MA-100 is dark blue. There is no doubt that the risk/reward is better using the shorter period despite triggering more trades.
Using moving averages, as shown below, seems like a winning strategy, but applying this strategy to any stock will not work. There are too many conditions that need to be factored in.
For example, a stock with low volatility (movements) will trigger an infinite number of signals, and for most traders, the trading fees will be higher than the potential gains. Finding an optimal moving average for your period requires backtesting. Since it is a lagging indicator, it will not guarantee future movements.
Adjusting moving averages for volatility and liquidity.
One of the most common mistakes in using moving averages is the use of pre-determined values.
A general rule of thumb is that the higher liquidity, the more reliable the signal will be. This applies not only to moving averages but to all signals and indicators. The reason for this is the underlying number of data/trades on which the averages are based.
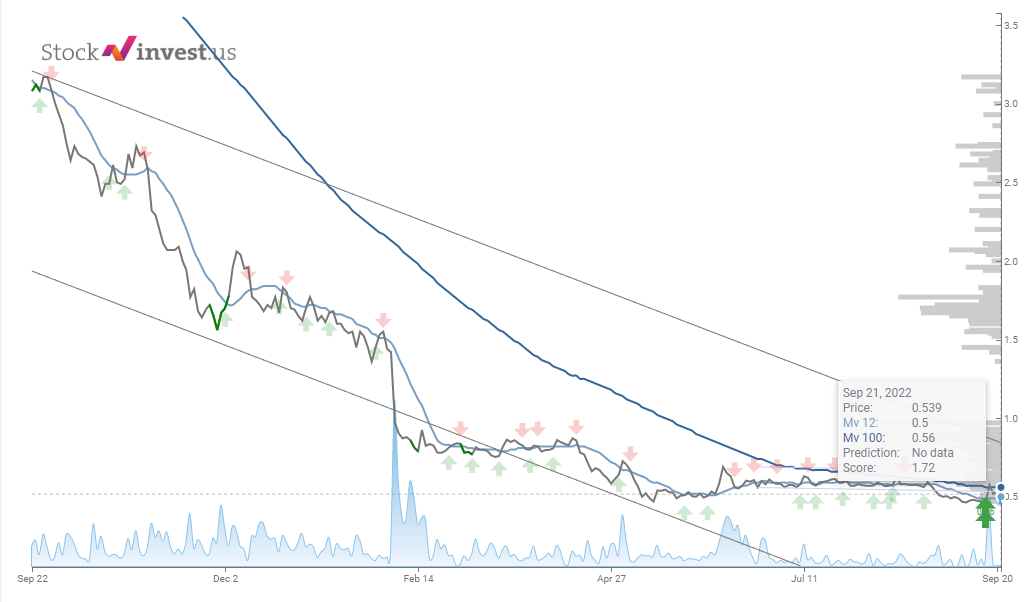
Below are the 12-month charts (Sep 21 – Sep 22) of Lannet Co Incorporated [LCI]. A company traded at New York Stock Exchange (NYSE) with low trading volume, and GCP Applied Technologies [GCP] with exceptionally good liquidity but low volatility. The low liquidity and volatility make use of the same MA35 and MA100 as in the Apple chart above almost meaningless. Using a short moving average in a stock with low liquidity and volatility will only trigger too many signals and yield little profit.
The general trend will determine the success of using moving averages in trading.
Using the moving average on stocks in falling trends to trigger buy signals will have little success.
If we understand that the stock market moves in cycles and that the moving average has several conditions to work successfully. In that case, it becomes reasonable to measure the potential success rate for periods where the signal is most applicable.
While the moving averages had a success rate in the first Apple [AAPL] example, it is also clear that it had no success in the Lannet Co Incorporated [LCI] case. This emphasizes the need to consider the stock's general trend when applying the moving average as a trading strategy.
A general rule of thumb is that buy signals will do best in upwards trends, while sell signals will perform best in downward trends.
Understanding the limitations and conditions for using moving averages.
Articles describing the success rate of moving averages often need to mention the vital conditions for the signal to work optimally. In addition, the tests done for such research are often based on the same conditions for buying and selling, while no stock or trend is the same.
If you conduct a test using the MA, where you buy on the moving average breaking price down and sell on the moving average breaking up (standard MA signals), the return:
- Will be good for upward trends
- Truly little in horizontal trends
- And most cases, negative for downward trends.
The same applies to traders who base trading strategies on signals and indicators like moving averages, blindly using a fixed standard moving average for any stock they trade.
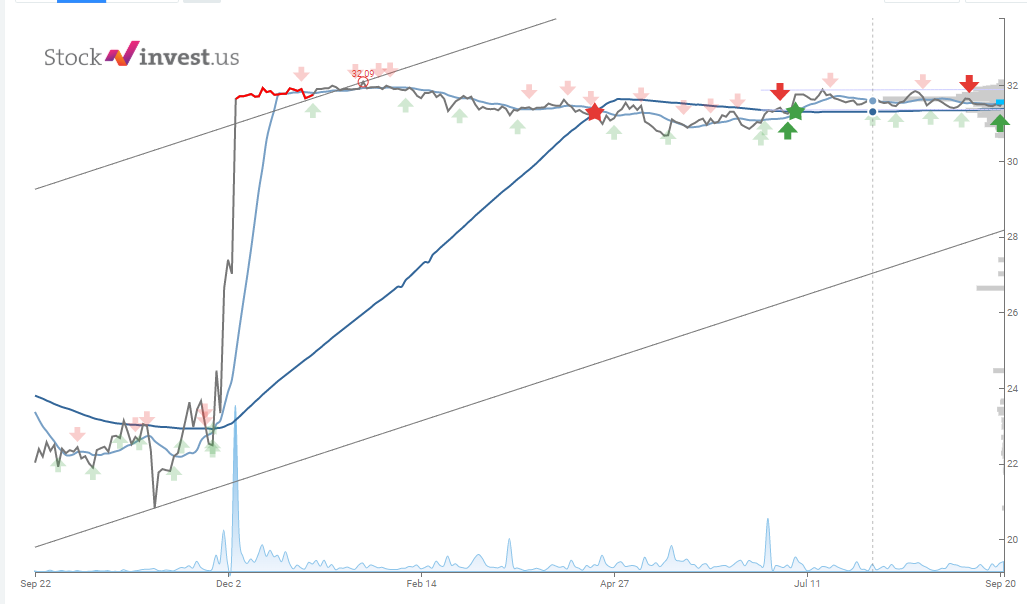
For example, using long MA as a buy indicator and short as a sell indicator reduce your overall risk, and increase your potential profit. As shown in the image below for the Sunrun Inc [SUN] stock.
Improving the Moving Averages.
I fell in love with the moving averages in my early years as a trader. I started to explore them deeper to optimize the utilization of the indicator/signal.
Early on, I understood that adjusting the moving average to the specific period and the volatility of the stock was vital for the success rate. For selected stocks standard smoothed average worked just perfectly, while for some selected stocks, a weighted moving average would work better, and so on.
Today there are more than a dozen averages (AV) and thousands of opinions on which works best. Fast computers and good software allow for stronger backtesting. But like Joe Marwood in Stocksoft Research concluded after testing in 2015: "Second, newer and more complex moving averages appear to be no better at finding trends than the more traditional moving averages."
I reached the same conclusion back in 2006. However, testing in 2016 gave interesting insights into the complexity of the question. During the ten years between the tests, more types of averages have also become available.
In the examples below, I have included test results using eight moving averages and two different time periods (MA7 and MA35). These tests were performed on the GoPro Inc. [GPRO] stock using a short 90-day period. Tests on other stocks revealed different results. Therefore, the conclusion of all tests is the same;
?You should apply different moving averages and periods based on the stock you trade. Backtesting will only give you an indication as you cannot find the right moving average type or timeframe for the future.
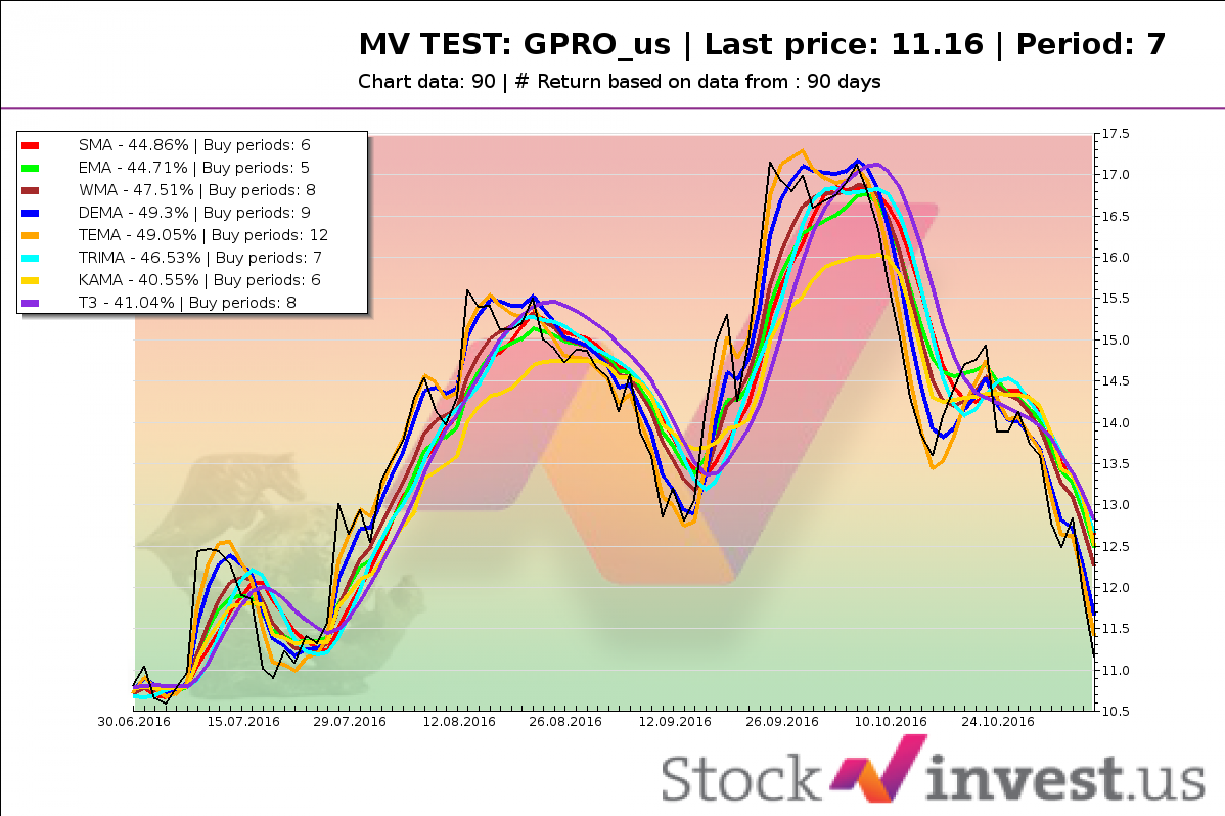
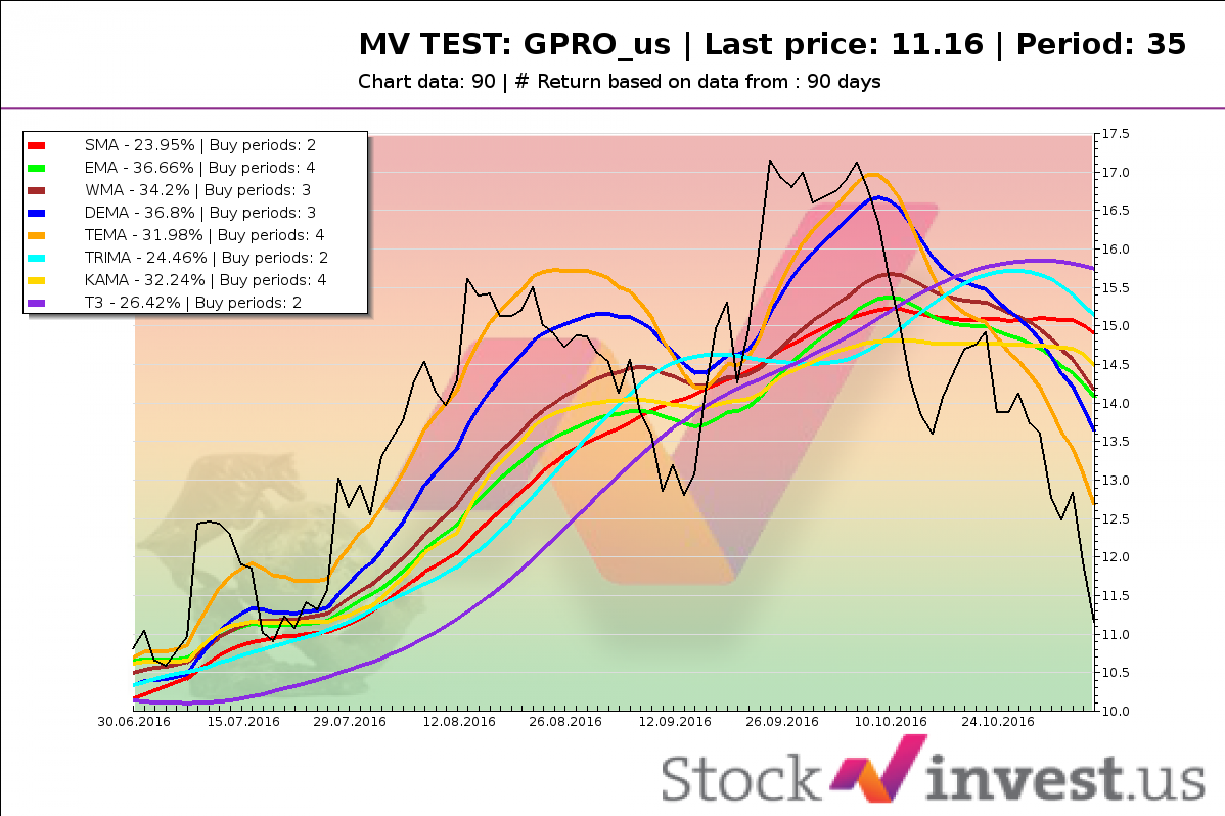
In both tests, the aim was to find the best moving average type using crossing the price line as both a buy and sell indicator.
The clue to improve the moving averages came after as I tried to find the optimal moving average based on volatility for the selected trading frame. I was running 100 tests on different stocks and was able to land on a few general conclusions. In a general population, you can use standard MA's, and Weighted Moving Average (WMA) performs best from these.
After this, the second task was finding the optimal moving averages (period) to trigger the well-known Golden Cross. Until then, the notion was that to find the Golden Cross better use MA50/100 or MA100/200. My tests showed that the optimal MA's must be identified individually for each stock. Under extensive testing, I came across the idea of adding more conditions, and the Golden Star™ signal was born.
The birth of the Golden Star Signal.
Between 2003 and 2007, I focused on stock trading and a growing family. During these years, the Golden Star™ Signal was born.
The idea of the signal came from extensive testing and looking at thousands of charts. While evaluating the different moving averages, I noticed that the more optimal I was in tuning the moving averages, the closer the Golden Cross got to the price line.
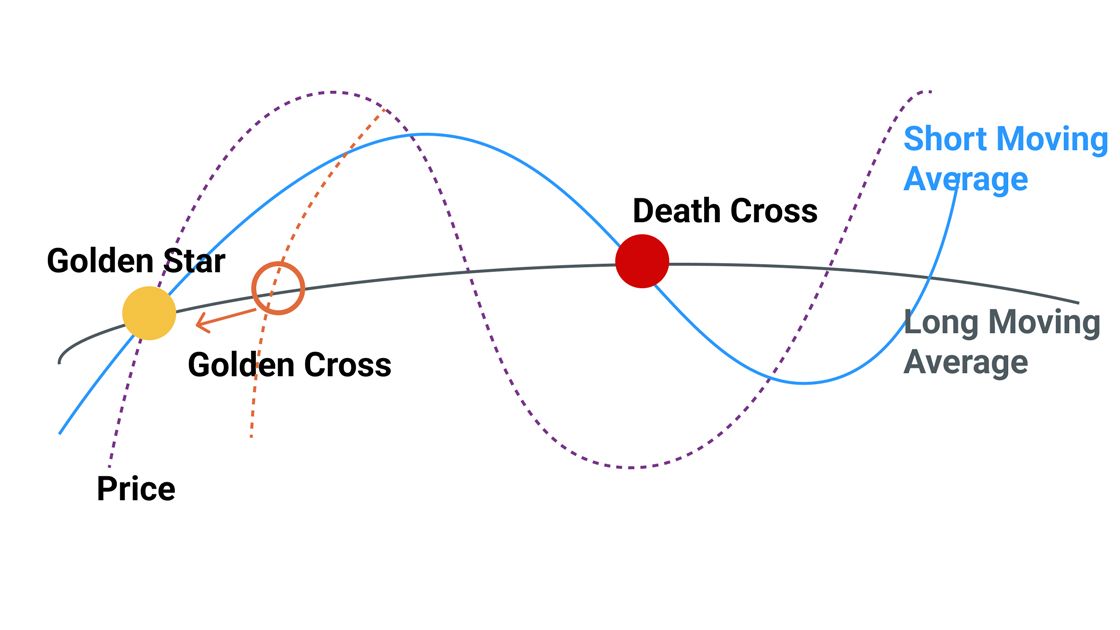
Based on this visual observation, I started extensive testing with the condition that the averages should cross the price line at the same time. To my surprise, the tests all gave the same answer, and I was achieving a higher success rate than ever before. Since the signal is just an extension of the Golden Cross, I decided to name it Golden Star™ and its opposite sibling for, the Death Star™.
The signal was first available for limited users on Getagraph.com in 2006 but was completed and made fully available to users of the webpage in 2007.
The fails and the flaws of the Golden Star.
After a successful launch of the signal early in 2007, the stock market took a sudden turn at the end of 2007 with the merging banking crisis.
After producing steady results and signals, the signal suddenly became exceedingly rare. It was as low as 1:3000 on the standard Golden Cross in the worst down period. It simply ceased to exist. Users paying subscriptions to access the Golden Star™ started complaining about the lack of signals. The success rate when the signal first is found was neither any better than the standard Golden Cross. Stressed about this, I went on to assess many new conditions.
? A few were added, but the overall conclusion was that Golden Star™, like all moving averages, is not especially useful as a buy signal in a downward trend. But the opposite signal, the Death Star™, would produce meaningful results.
With ever-growing instruments and the possibility of shorting, the utilization of the Death Star™ signal has become more attractive.
While the average return on the Golden Star™ is high, the question is always when to exit the signal. Like most moving averages, most return is lost waiting for the opposite signal. In a simulated situation or general backtesting, you can measure the peak of the price. However, in live trading, you will never be able to determine the exact top as it occurs. Due to extensive backtesting, I could derive average returns and probabilities. These returns are subject to various conditions. Without listing them all, they mostly reflect two major conditions: volatility/liquidity and the stock trend. The signal will work well for the S&P 500 stocks but not for OTC stocks.
The last but most significant issue is determining the tolerance for the actual crossing price. The chances for the price, the short MA, and the long MA to cross at an exact price is slim to none. To produce signals, you will have to allow a small margin of deviation, but how much? Again, we enter a minefield of different dependencies and conditions. While 0.5% is much in one stock it is nothing in another stock. Today fortunes are made by trading decimals in the stock market.
What makes Golden Star™ a better signal than other signals from moving averages?
?In general, using the signal from the crosses between the short and long moving averages will yield a higher chance of success.
This is mainly because using only a singular moving average will generate more signals. Without a proper exit method or properly selected period for the signal, you will not be able to gain sustainable profit.
The slowness and length of the longer signal, Golden Cross/ Death Cross, will allow more time for a decision, and the expected movement of the signal (return) will be higher.
The signal response time is vital. As moving averages are a lagging indicator, you will lose out on gains because you will get in after the upturn has already started.
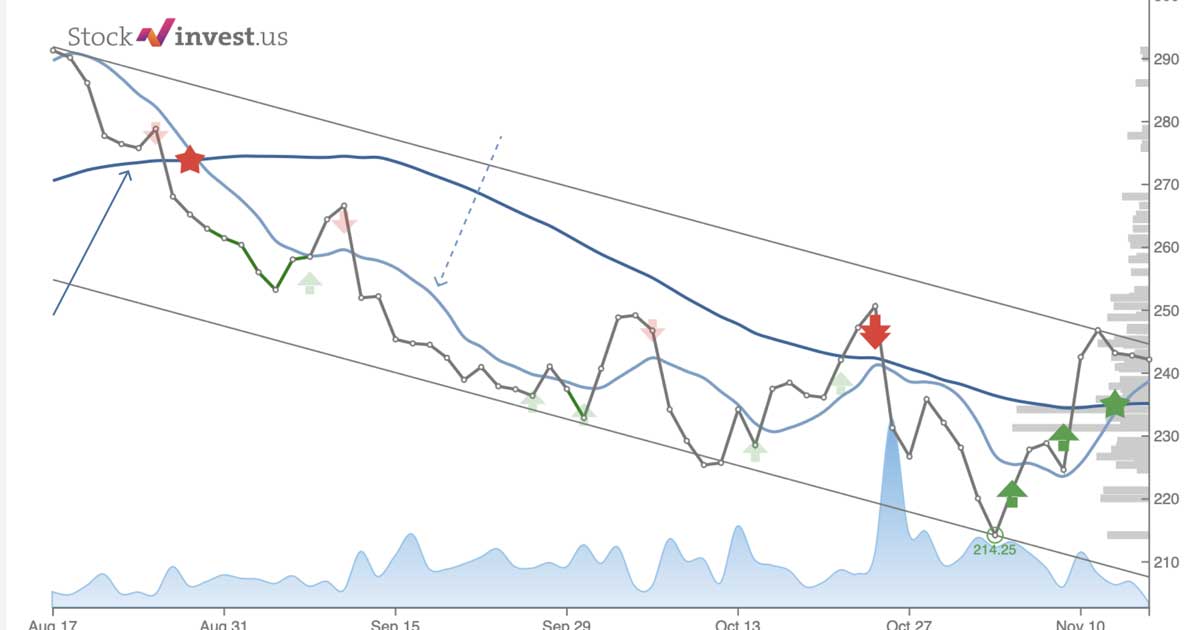
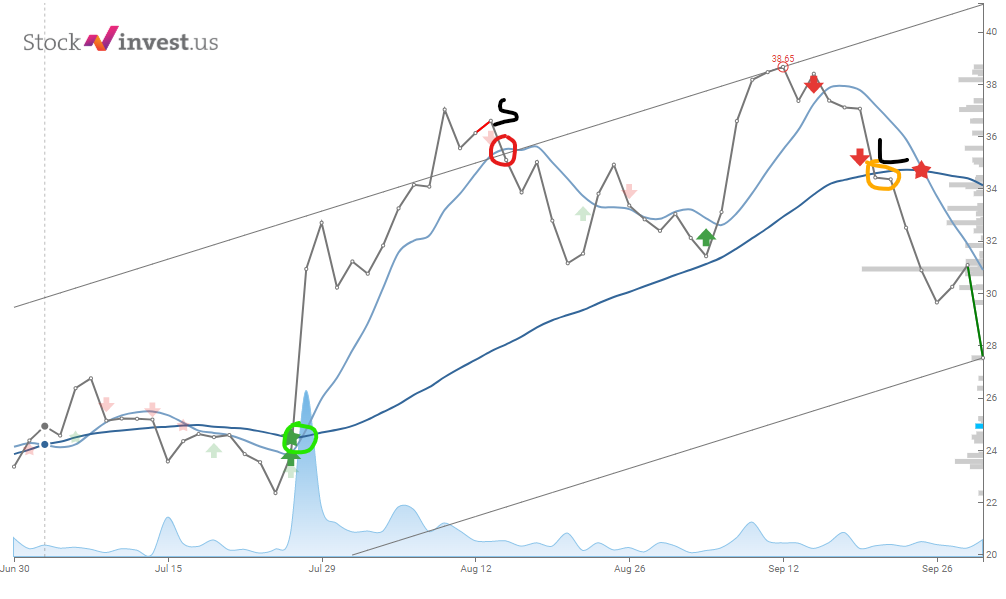
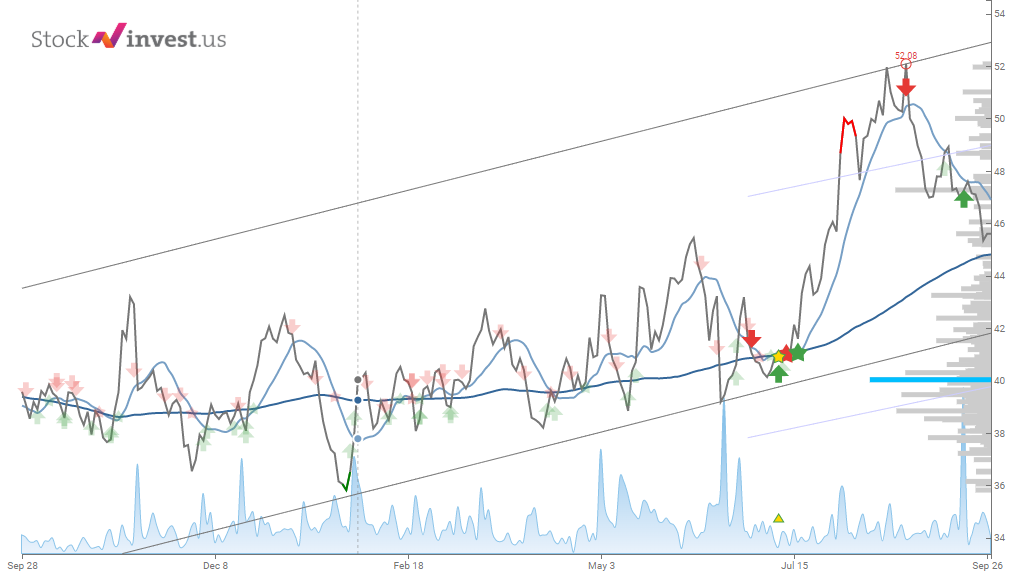
The Golden Star™ is triggering earlier than the standard Golden Cross, the strict requirements for the signal to be found also cause less false signals. These differences are shown in the chart below for the Sanmina Corporation stock [SANM]. Shortly after the Golden Star™ was identified on June 11th, 2022, the moving averages gave a Death Cross (red star), which turned out to be false and later flipped to Golden Cross (green star).
Due to the methodology applied to identify the Golden Star™, adaptive time frames, and other requirements described in this article - the Golden Star™ can be perceived as a better signal than standard moving averages and derivations like the Golden Cross.
Best practice for the use of the Golden Star™.
? Like in all signals and indicators, there are also a certain amount of insecurity and error variables in the Golden Star™.
Most of the variables discussed earlier in the article lay the ground for the best practice using the signal. However, here is a short list:
- Works significantly better in upwards trends;
- Performs significantly better for liquid stocks;
- It works best when picked early, and stop-loss is set just below the signal price;
- A good Golden Star™ is usually very intuitive by looking at the chart;
- A good Golden Star™ is generally followed by positive changes in volume.
The success rate and risk reduction of all signals can be enhanced by combining other signals and fundamental data. Long-term technical signals are often used to verify the fundamental analysis. The experienced investor would use the best of both worlds, where solid fundamentals along with a Golden Star™ signal will reduce the general risk and increase the chance for a successful investment.
About the inventor.
Jim Stromberg started stock trading in 1996 using technical analysis as part of the decision-making process.
He holds a master's degree in Innovation Management from ISM University of Management and Economics, Vilnius, Lithuania. During his career, he had various working positions in and outside the financial sector.
From 2005 until 2013, he ran the Getagraph.com webpage that offered technical analysis to its users. After minor updates, it was rebuilt and released under the StockInvest.us brand (in 2016).
Stockinvest.us has, as of November 2022, more than 230 000 registered users worldwide, and one of the services offered is the Golden Star™.


